

The ROI of AI-assisted software engineering is the value of extra complexity-weighted output AI helps produce, minus the full AI-related cost, divided by that cost. Proving it takes a pilot of 8-12 weeks. Before it starts, record how the team performs today so you have something to compare against. During the pilot, make sure speed doesn’t come at the expense of quality: watch how often changes break production, how much work has to be redone, and how often output passes automated checks. Finally, decide up front what results will lead you to expand, adjust, or end the pilot.
For a lot of engineering leads, the first few months of an AI pilot go pretty smoothly. Licences are active, the adoption dashboard is all green and the engineers are saying they’re faster so it looks like it’s working. The real question comes when finance looks at what the spend has actually delivered as an AI investment that grows with every token consumed needs to have a figure that the budget review can look at.
The initial impressions that make the pilot look healthy provide very little basis for building that figure, as actual measured gains are invariably well below what usage would suggest. A longitudinal AI developer productivity study from DX illustrates just how wide that gap can be. They tracked PR throughput across 400+ organizations from November 2024 to February 2026 and found that as AI tool usage increased by an average of 65%, median PR throughput only increased by 7.76%, with the majority of organizations ending up in the 5-15% range.
Stanford research is pointing in the same direction, finding the productivity gains are concentrated in the simpler greenfield work and part of the gross output is consumed by rework. That still leaves the engineering leaders with a route to the finance types as the return on AI assisted software development can be demonstrated by a pilot designed for proof, from the formula through to the decision rule.
What Is the ROI of AI-Assisted Software Engineering?
ROI in AI assisted engineering is the value that the AI brings to the team (i.e. the output it enables) compared to the total cost of the AI. In that calculation the cost is all AI related spend, the value is the additional engineering output plus the quality savings achieved at the same headcount and the return is value less cost, on a cost basis.
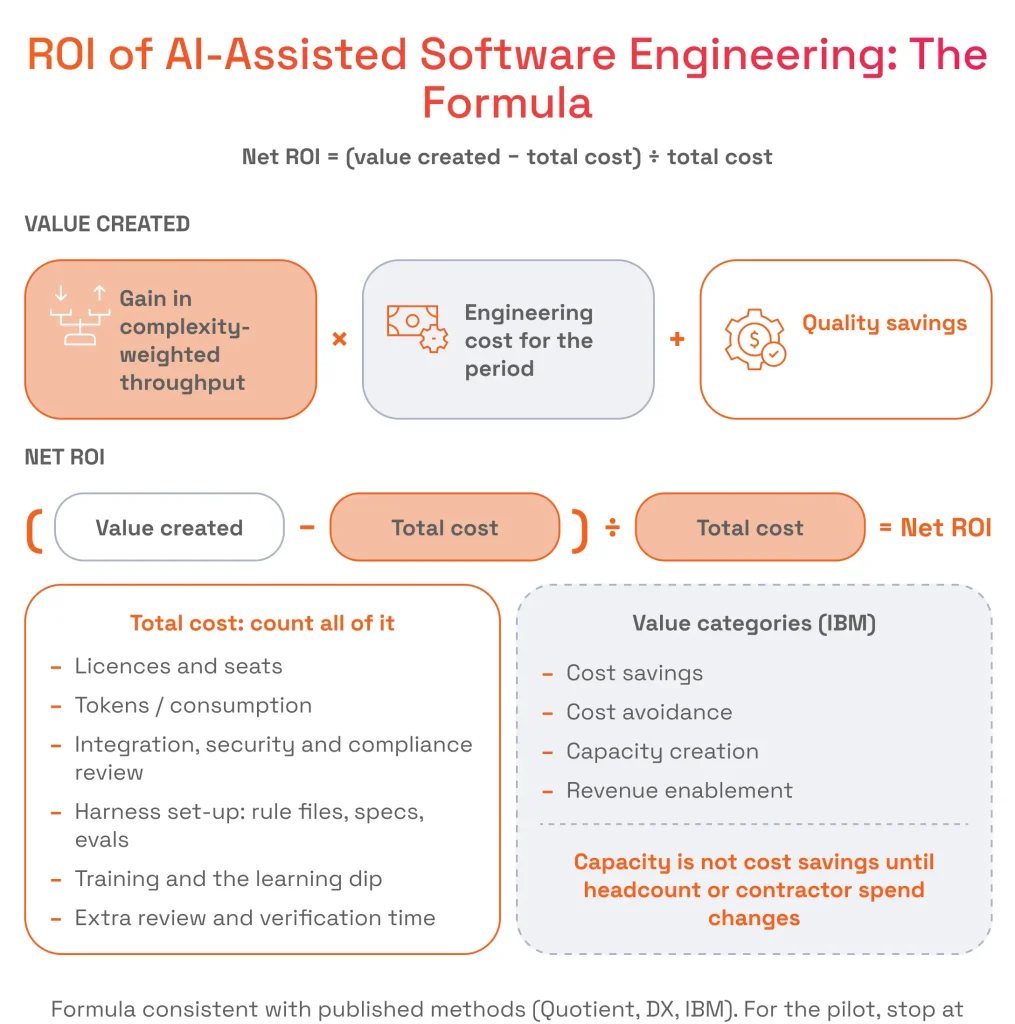
Before the formula can be used we need two definitions on the value side, the first being what we mean by output. Delivered output is the unit of business value as it’s the merged, working changes that the business pays the engineers to produce. Code volume is a much weaker unit as it’s so easily inflated and AI-generated code can take line count up massively whilst adding review overhead and future maintenance cost.
The second definition is the value of extra output. At SPD Technology we break this down into four categories:
- cost savings,
- cost avoidance,
- capacity creation
- and revenue enablement.
In the pilot, capacity creation is the category the formula picks up most directly as the throughput term is a measure of extra output at the same headcount. That capacity becomes a cost saving only when headcount, hiring or contractor spend actually changes. Until that point finance can price it in dollars at loaded rates and the business can reinvest that capacity in backlog work.
Revenue enablement is the one area that is furthest from anything a pilot can actually measure so a pilot should stop at engineering output. Revenue growth and all the other business outcomes are a function of product decisions, market timing, and sales execution. That’s why you don’t attribute them to AI in the pilot. That’s the job of the subsequent business case, which will be built on the pilot’s verified numbers and its payback period.
Why Do Most AI Coding Pilots Fail to Prove ROI?
The vast majority of AI coding pilots fail to demonstrate any ROI as they start off without a baseline, they read out in the learning dip, they measure activity and test a tool whilst the way of working remains exactly the same. Each of those flaws is a number that finance can walk away from, and many of the pilots will have all four of those issues at the same time.
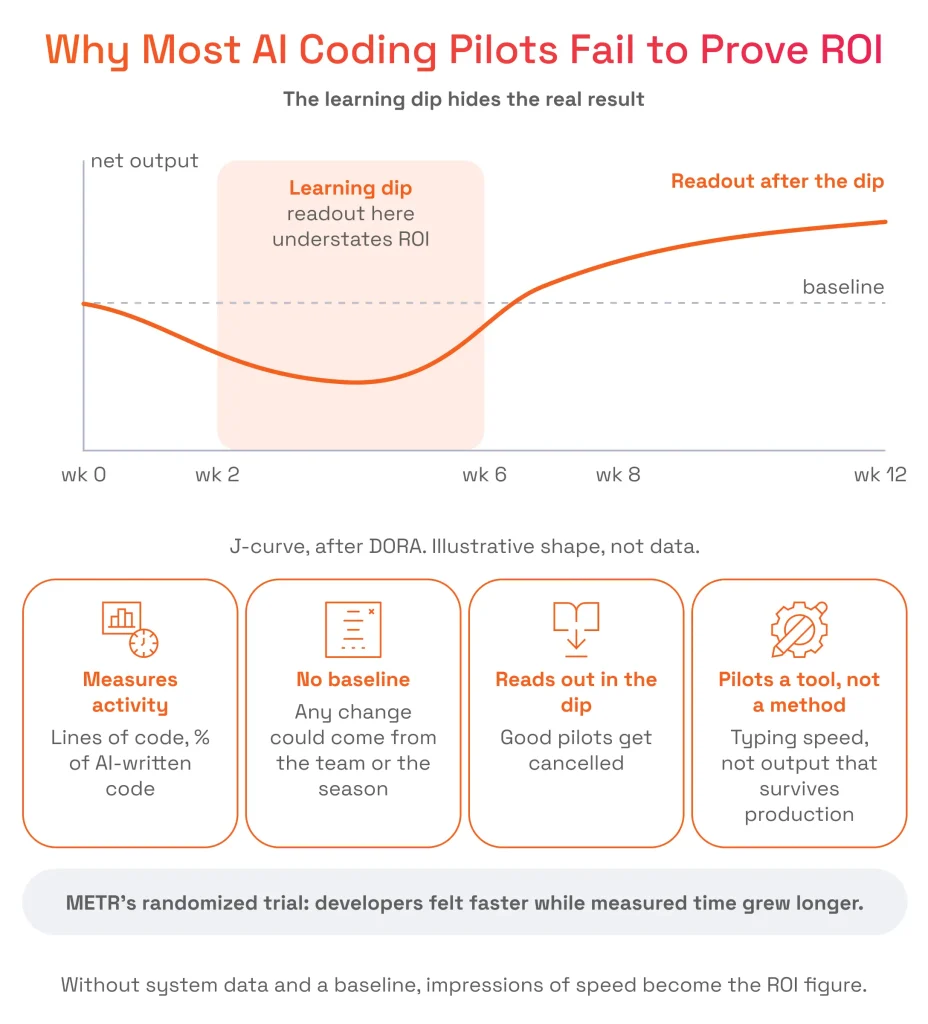
Without a baseline, impressions fill the gap, and impressions drift far from data. In a METR randomized controlled trial, 16 experienced open-source developers working on their own mature repositories expected AI to make them 24% faster and afterward believed it had made them 20% faster. Measured task completion took 19% longer with AI allowed, a roughly 39-point gap that METR presents as a snapshot of early-2025 tools in mature codebases. Teams working out how to trust AI-generated code learn the same lesson one change at a time.
Timing, of course, distorts the numbers. Even a well-measured pilot will slow right down in its first few weeks as the engineers get to grips with the tools and the review and release processes suck up the volume. Plotted week on week, you often get a J curve, so a reading taken too early will show the cost of the tuition before the later weeks have had a chance to pay it back.
Once the curve starts to go up, the activity metrics start to lie to the pilot. The bulk of the work on a feature is done by the agents, and the remainder is consumed by the edge cases, integration, and correctness checks. That verification tax is what causes gross output to rise faster than net output, exactly the same rework pattern as described by the Stanford research.
Closing that gap takes a method, which is why testing a tool on its own is the fourth flaw. Agentic AI development builds software where coding agents work inside human-defined specs, tests, evals, and feedback loops across the software development lifecycle, so every release can be verified. Vibe coding sits at the far end of that spectrum, with little structure, light verification, and human judgment applied late. A tool trial captures adoption and typing speed, while a method pilot built on an agentic development workflow measures whether output survives review and production.
Any legitimate case for AI to improve developer productivity is predicated on that second metric.
How Do You Design an AI-Assisted Engineering Pilot?
A pilot built to prove AI ROI is fixed on paper before any tool is switched on. To get there, the team writes a falsifiable hypothesis, chooses representative work from across the software development lifecycle, picks a comparison design and sets guardrails for code quality. It also names one owner for the result, so someone is accountable for the findings when the next decision on AI adoption comes up.
Start from the business constraint
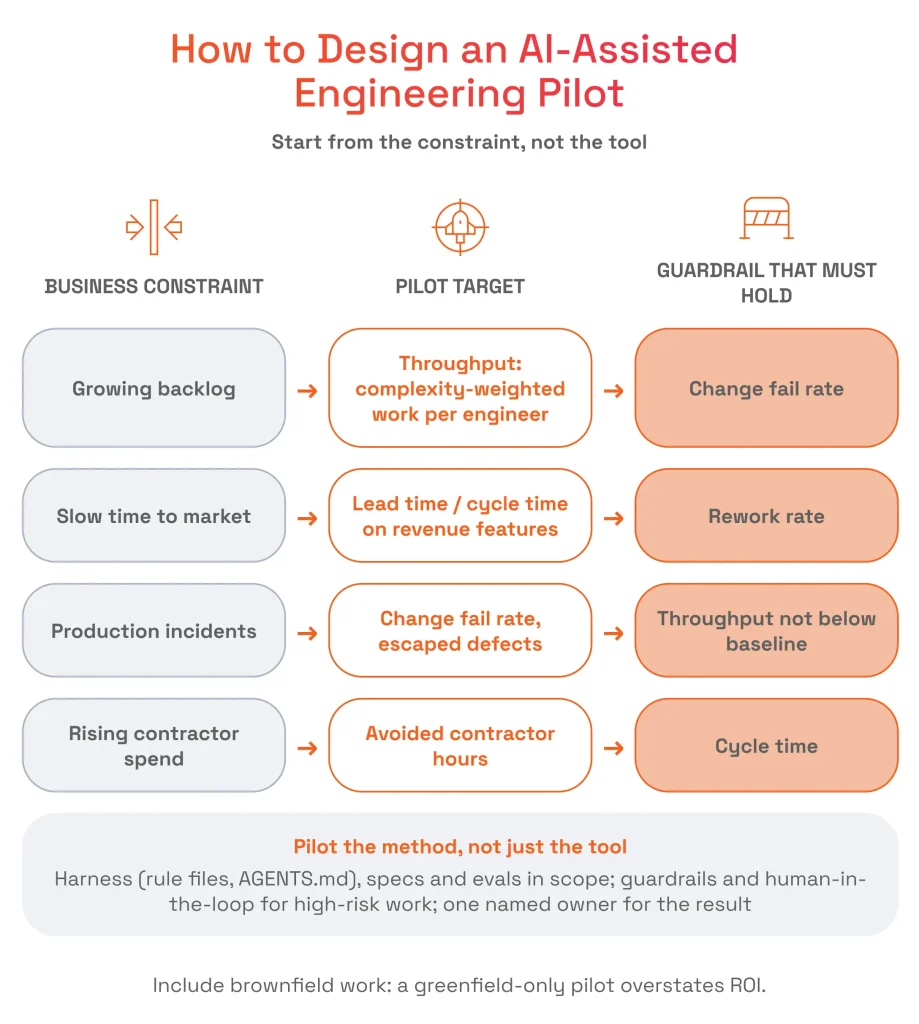
The constraint comes first and the tool second as a target only has value as a finance item if it relates to a problem the business is already spending money to solve. Each target also requires a guardrail metric which must be met as the target evolves.
Business constraint | Pilot target | Guardrail that must hold |
|---|---|---|
Growing backlog | Throughput: complexity-weighted work per engineer | Change fail rate |
Slow time to market | Lead time / cycle time on revenue features | Rework rate |
Production incidents | Change fail rate, escaped defects | Throughput not below baseline |
Rising contractor spend | Avoided contractor hours | Cycle time |
Business constraint
Growing backlog
Slow time to market
Production incidents
Rising contractor spend
Pilot target
Throughput: complexity-weighted work per engineer
Lead time / cycle time on revenue features
Change fail rate, escaped defects
Avoided contractor hours
Guardrail that must hold
Change fail rate
Rework rate
Throughput not below baseline
Cycle time
Choose work that represents your real mix
Brownfield work belongs in the pilot alongside greenfield tasks. That matters because the Stanford research found that gains from AI-assisted development shrink on complex legacy codebases, so a pilot run only on new services overstates the return for an estate that is mostly brownfield. To see the real value for your developers, pull tickets from the backlog they actually work in, keeping the usual proportions of feature work, bug fixes, and maintenance.
Pick a comparison design
The comparison design decides what the measured gain can be attributed to. Choose the strongest design your team structure allows.
Design | When to use | Watch out for |
|---|---|---|
Pre/post, matched windows | No spare team for a control group | Org changes in the same period |
Pilot team vs similar control team | Two teams with comparable work | Pre-existing performance gaps between teams |
Phased rollout | Several teams adopting in sequence | Longer total timeline |
Design
Pre/post, matched windows
Pilot team vs similar control team
Phased rollout
When to use
No spare team for a control group
Two teams with comparable work
Several teams adopting in sequence
Watch out for
Org changes in the same period
Pre-existing performance gaps between teams
Longer total timeline
Put the engineering method inside the pilot
The method around the agents belongs in pilot scope, because it determines whether faster output holds up after merge. That scope covers the harness, which includes rule files such as AGENTS.md, tools, sandboxes and hooks, along with the specs and evals the agents work against. The practice of agent harness engineering treats that configuration as versioned engineering work with its own review, so changes to the harness are tracked as carefully as the generated code itself.
High-risk changes need guardrails and human-in-the-loop review, an approach we call calibrated autonomy. Under it, agents act freely on low-risk work and hand control to a person as risk rises. For that to work, clear AI engineering enablement guardrails define which changes count as high-risk before the first agent run. Alongside those rules, one named owner, usually the VP Engineering or Head of Delivery, answers for the result.
What Baseline Do You Need Before Day One?
Without a baseline captured from system data, no ROI claim survives a finance review, however solid the calculations look. That is because any change the pilot shows could otherwise come from the team, the scope or the season. A pre-pilot baseline is the only way to separate those causes and measure AI by its own contribution to the result.
Capture the following data points, ideally from 8-12 weeks of history so the comparison covers normal variation across sprints:
- Complexity-weighted throughput per engineer per week is the core value metric the ROI formula multiplies.
- Lead time and cycle time show whether work reaches users faster.
- Change fail rate and rework rate set the stability guardrails the gain must hold against.
- Escaped defects give the quality savings line its starting point.
- Review time per PR exposes the verification cost that extra AI-generated volume adds.
- Current AI spend, including licences already in use, anchors the cost side.
- Fully loaded engineering cost comes from finance, because a CFO will question any rate engineering estimated alone.
- A short developer-experience pulse records sentiment for later use as a guardrail.
Weight throughput by complexity so that splitting work into more PRs cannot inflate it, and re-baseline whenever team, tools or scope change. Every later ROI claim needs a fixed reference point to stand on. SPD Technology measured the ticketing platform engagement against a flat 2025 baseline at constant headcount, which kept each 2026 figure comparable.
The platform health metrics a team already tracks usually cover most of the delivery data on this list.
Which Metrics Show the Real Impact of AI on Engineering?
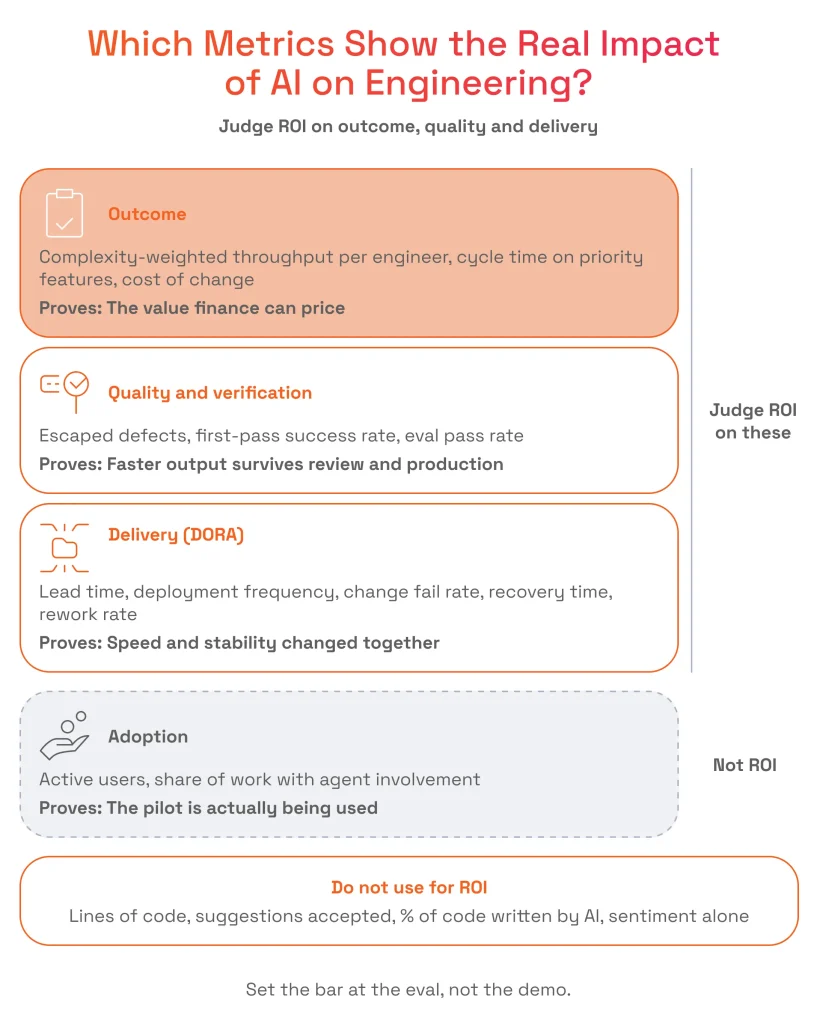
To measure AI impact on engineering, track metrics in three layers: adoption shows the pilot is running, delivery shows engineering changed, and quality and outcome show finance it mattered. Judge ROI only on the delivery and outcome layers, and read adoption as a sign the experiment is live.
How to Measure AI Impact on Engineering
Layer | Metrics | What it proves |
|---|---|---|
Adoption | Active users, share of work with agent involvement | The pilot is actually being used |
Delivery (DORA) | Lead time, deployment frequency, change fail rate, failed deployment recovery time, rework rate | Speed and stability changed together |
Quality and verification | Escaped defects, first-pass success (share of changes accepted without rework), eval pass rate | Faster output survives review and production |
Outcome | Complexity-weighted throughput per engineer, cycle time on priority features, cost of change | The value finance can price |
Layer
Adoption
Delivery (DORA)
Quality and verification
Outcome
Metrics
Active users, share of work with agent involvement
Lead time, deployment frequency, change fail rate, failed deployment recovery time, rework rate
Escaped defects, first-pass success (share of changes accepted without rework), eval pass rate
Complexity-weighted throughput per engineer, cycle time on priority features, cost of change
What it proves
The pilot is actually being used
Speed and stability changed together
Faster output survives review and production
The value finance can price
Delivery metrics: DORA and cycle time
Keep DORA metrics as the delivery layer, extended with cycle time on priority work. The DORA 2025 State of AI-assisted Software Development report describes AI as an amplifier of an organization’s existing strengths and weaknesses. It finds AI adoption associated with higher delivery throughput and, at the same time, higher delivery instability.
That pairing is why change fail rate and recovery time act as the guardrail on any speed gain. A claim about AI developer productivity holds only when throughput rises while those stability metrics stay flat or improve.
Quality metrics: rework, defects and first-pass success rate
First-pass success is the share of changes accepted through review and testing without rework. The majority of problems becomes visible here as generation speeds up, completion lags, and the difference shows up as changes sent back.

Serhii Leleko
AI & ML Engineer at SPD Technology
“The first number I check in any AI pilot readout is the first-pass success rate. If merged PRs go up while first-pass success goes down, the team has shifted effort from writing code to reviewing and fixing AI-generated code, so the throughput chart ends up counting the same work twice.”
Rework serves as an ROI guardrail because it is a cost that borrows capacity from future sprints. AI technical debt surfaces here first, as a rework rate that climbs a few sprints after merge volume does. The connection between rework and development velocity matters for the cost model, since every reworked change is paid for twice.
Set the bar at the eval
Tests check deterministic behaviour, and evals score non-deterministic AI behaviour against a rubric. For agentic or AI features, eval pass rate works as an acceptance gate, and a change that lowers it stays out of the release.
A gate like this is only as reliable as the checks behind it, and AI-written tests can weaken those checks without anyone noticing. Test-fidelity controls in our engagement with a ticketing platform flag weakened assertions and skipped checks, the cases where an AI-written test passes without validating functionality. Knowing how to evaluate AI agents before production extends the same scrutiny from single tests to whole workflows. Building the suite that runs those checks is the job of eval engineering.
These gates decide which output counts toward ROI, and some popular metrics should stay out of the calculation entirely: lines of code, accepted suggestions, the percentage of code written by AI and sentiment alone. Sentiment works as a guardrail and carries no dollar value.
How Do You Calculate ROI and Cost of Change from a Pilot?
Calculating ROI from a pilot means valuing the extra complexity-weighted output at the team’s fully loaded cost, adding the savings from quality improvements and subtracting the full AI-related cost. Present the result as a range with a payback period, because a single figure reads like the output of a rigid mathematical formula and hides how sensitive the financial impact is to each input.
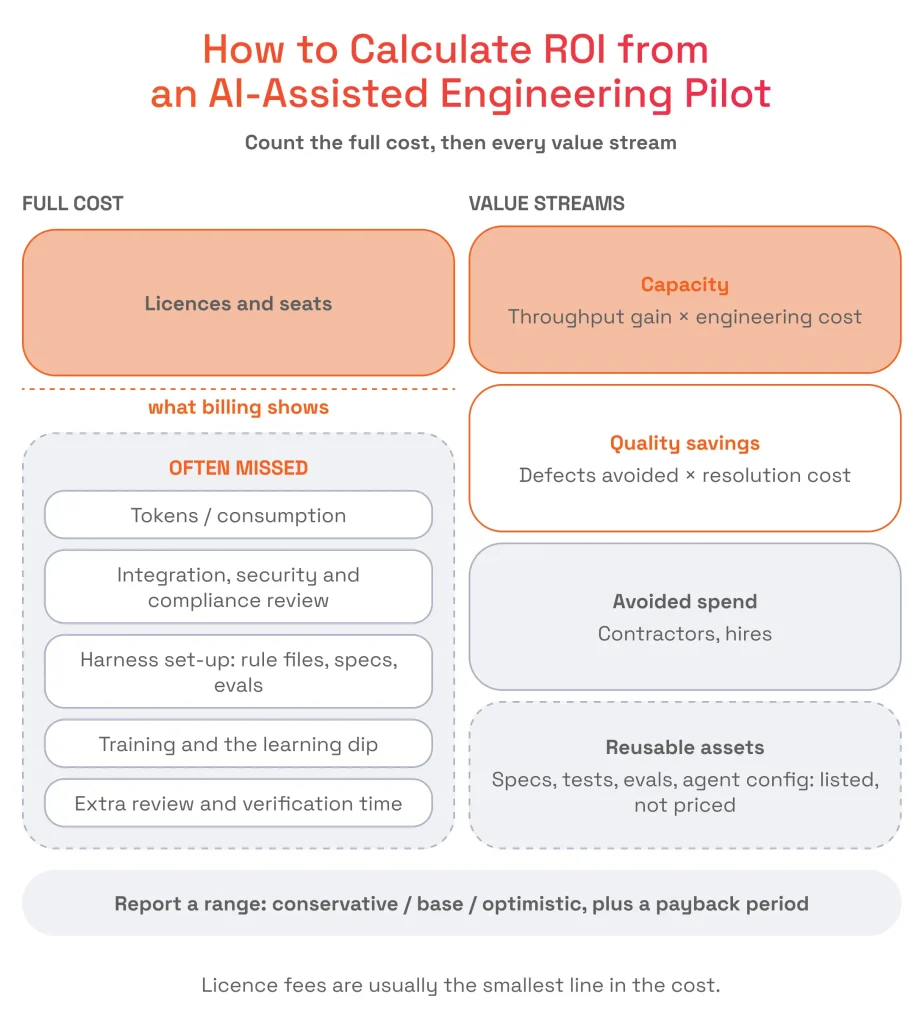
With that in mind, start with the cost side, where most pilots undercount.
Cost line | Source | Often missed? |
|---|---|---|
Licences and seats | Billing | No |
Tokens / consumption | Billing; scales with agent use and model choice | Yes |
Integration, security and compliance review | Project records | Yes |
Harness set-up: rule files, specs, eval suites | Project records | Yes |
Training and the learning dip | Time tracking, baseline gap | Yes |
Extra review and verification time | Review time per PR vs baseline | Yes |
Cost line
Licences and seats
Tokens / consumption
Integration, security and compliance review
Harness set-up: rule files, specs, eval suites
Training and the learning dip
Extra review and verification time
Source
Billing
Billing; scales with agent use and model choice
Project records
Project records
Time tracking, baseline gap
Review time per PR vs baseline
Often missed?
No
Yes
Yes
Yes
Yes
Yes
The harness set-up row is where spec-first development concentrates effort at the start of the work, which makes that cost easy to record. Token spend behaves differently, because in AI-assisted software development it rises with agent use and moves with the very tool adoption the pilot encourages.
Value stream | How to price it |
|---|---|
Capacity | Throughput gain × engineering cost for the period |
Quality savings | Defects avoided × resolution cost, valued with the business owner |
Avoided spend | Contractor hours or hires that no longer happen |
Reusable assets | Specs, tests, evals and agent configuration the pilot leaves behind — listed and left unpriced |
Value stream
Capacity
Quality savings
Avoided spend
Reusable assets
How to price it
Throughput gain × engineering cost for the period
Defects avoided × resolution cost, valued with the business owner
Contractor hours or hires that no longer happen
Specs, tests, evals and agent configuration the pilot leaves behind — listed and left unpriced
Quality savings rest on remediation cost, since a defect caught before release avoids the incident handling and patching that the security risks of AI-generated code can trigger later.
Value = G × C + Q
Here G is the complexity-weighted throughput gain against baseline, C is the engineering cost for the period, Q is quality savings and S is total AI-related spend. Alongside the formula, it helps to track cost of change, which is the effort required to make a typical change safely. For a CFO, that metric shows whether AI output lowers future cost or raises it through debt, rework and harder reviews.
To turn the result into a range, run the formula three times. The conservative case uses the lower bound of the measured gain and the full cost, including the temporary productivity dip while the team works through the learning curve. The base case uses the median gain, and the optimistic case treats the dip as a one-time cost. From there, the payback period follows from total spend against the value created each month, and finance should agree on the threshold before week 0.
Two levers bring S down while leaving G intact. Model routing sends each task to the cheapest of the available AI models that meets the quality bar, and token budgets per team or workflow keep consumption within agreed limits.
What Does a 90-Day AI-Assisted Engineering Pilot Plan Look Like?
The 90-day plan runs in three phases (set up and baseline, run and measure, analyse and decide), and each phase closes with a gate. Expect a learning dip somewhere in weeks 2–6 and schedule the readout after it, because a readout taken inside the dip measures the learning curve.
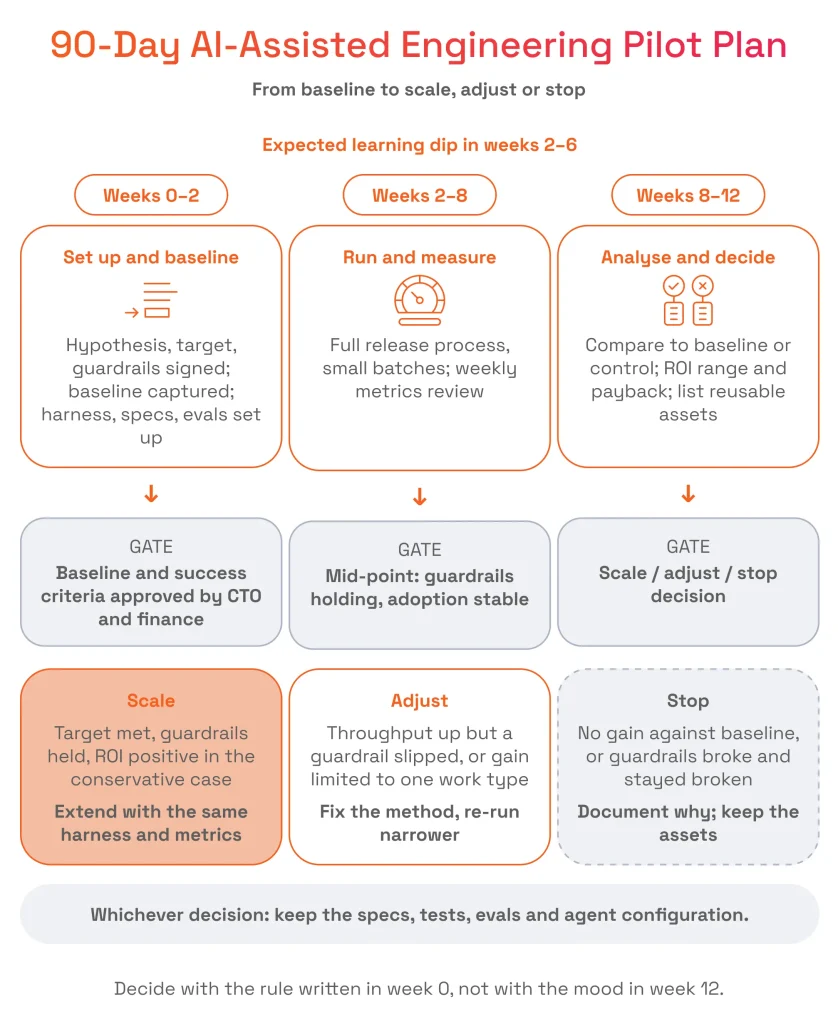
90-day AI-Assisted Engineering Pilot Plan
Weeks | What happens | Gate |
|---|---|---|
0-2 | Hypothesis, target and guardrails signed; baseline captured; harness, specs and evals set up; access and autonomy rules agreed | Baseline and success criteria approved by CTO and finance |
2-8 | Work runs through the full release process in small batches; weekly metrics review; retrospectives look for false gains | Mid-point check: guardrails holding, adoption stable |
8-12 | Compare against baseline or control; compute ROI range and payback; document reusable assets | Scale / adjust / stop decision |
Weeks
0-2
2-8
8-12
What happens
Hypothesis, target and guardrails signed; baseline captured; harness, specs and evals set up; access and autonomy rules agreed
Work runs through the full release process in small batches; weekly metrics review; retrospectives look for false gains
Compare against baseline or control; compute ROI range and payback; document reusable assets
Gate
Baseline and success criteria approved by CTO and finance
Mid-point check: guardrails holding, adoption stable
Scale / adjust / stop decision
False gains tend to look ordinary in a weekly review. PRs split to look smaller, hard tickets moved off the pilot team, or work reclassified to a lower complexity tier. Retrospectives in the middle phase should check for each of them by name.
Want to see how a 90-day plan carries a prototype all the way into production?
Read our guide to AI MVP to production in 90 days.
What Are the Most Common Mistakes When Measuring AI Impact?
Most mistakes in measuring AI impact either inflate the gain or hide the cost, and both distort the financial outcomes a pilot reports. These errors tend to go unnoticed until finance checks the numbers, though each one has a known fix.
Mistake | Effect on ROI | Fix |
|---|---|---|
Measuring adoption, lines of code or % of AI-written code | Reports activity as value | Use complexity-weighted throughput |
No baseline | Gain cannot be attributed | Capture 8-12 weeks of system data first |
Readout inside the learning dip | Understates ROI; good pilots get cancelled | Run 8-12 weeks; read out after the dip |
Greenfield-only pilot | Overstates ROI for a mostly brownfield estate | Pilot on representative work |
Ignoring quality after merge | Hides rework and AI technical debt | Track change fail and rework as guardrails |
Counting licences only | Understates cost | Include tokens, set-up, training, review time |
Self-reported time saved as the value input | Inflates the gain | Use system data; keep sentiment as a guardrail |
Mistake
Measuring adoption, lines of code or % of AI-written code
No baseline
Readout inside the learning dip
Greenfield-only pilot
Ignoring quality after merge
Counting licences only
Self-reported time saved as the value input
Effect on ROI
Reports activity as value
Gain cannot be attributed
Understates ROI; good pilots get cancelled
Overstates ROI for a mostly brownfield estate
Hides rework and AI technical debt
Understates cost
Inflates the gain
Fix
Use complexity-weighted throughput
Capture 8-12 weeks of system data first
Run 8-12 weeks; read out after the dip
Pilot on representative work
Track change fail and rework as guardrails
Include tokens, set-up, training, review time
Use system data; keep sentiment as a guardrail
Founders face the same scrutiny from investors, who probe pilot numbers through the questions investors ask about an AI PoC. An investor-ready MVP holds up in that conversation when its metrics come from system data.
How Do You Decide Whether to Scale, Adjust or Stop?
Decide whether to scale, adjust or stop by applying the rule written in week 0 to the week-12 data. Fixing that rule early keeps the decision from bending toward whoever argues hardest once the numbers arrive, which matters most when the outcome shapes a new rollout.
Decision | When | Next step |
|---|---|---|
Scale | Target met, guardrails held, ROI positive in the conservative case | Extend to the next teams with the same harness and metrics |
Adjust | Throughput up but a guardrail slipped, or gain limited to one work type | Fix the method (specs, evals, review flow), re-run on a narrower scope |
Stop | No gain against baseline, or guardrails broke and stayed broken | Document why; keep reusable assets; revisit the constraint |
Decision
Scale
Adjust
Stop
When
Target met, guardrails held, ROI positive in the conservative case
Throughput up but a guardrail slipped, or gain limited to one work type
No gain against baseline, or guardrails broke and stayed broken
Next step
Extend to the next teams with the same harness and metrics
Fix the method (specs, evals, review flow), re-run on a narrower scope
Document why; keep reusable assets; revisit the constraint
Scaling extends the same harness and metrics to new teams, where wider codebase variety and coordination load bring the AI MVP scaling risks that stay invisible inside one pilot team.
Whichever decision you reach, keep the specs, tests, evals and agent configuration, because the next attempt starts from them. Reusing those assets is also how compounding gains build up from one rollout to the next.
Before scaling, check the pilot’s output against our AI production-ready checklist.
Why Choose SPD Technology for AI-Assisted Software Engineering
At SPD Technology, our team designs AI-assisted engineering pilots that prove ROI through a practical framework, with the baseline captured first, guardrails switched on and the full cost counted, as part of our AI engineering services. One team owns both architecture and execution, so the method and the measurement come from the same people, drawing on 20 years and more than 460 delivered projects.
That approach shows in SPD Technology’s work with a project, where Claude Code supports the engineering team behind the ticketing platform, and all the results below come from that engagement.
- Measured against a real baseline. Engineering delivery output rose by 89%, measured as merged pull requests across all repos, while human-reported bugs fell by 81% and code-review throughput doubled with zero added latency. All three figures compare 2026 with a flat 2025 baseline at constant headcount.
- Throughput with guardrails. AI operations grew from 38 pipeline runs in July 2026 to 443 in August, with a 92% autonomous-run success rate at production volume. Throughout that growth, production incidents are investigated read-only, guardrails block unsupervised production actions and remote-facing actions wait for explicit human confirmation.
- The method is in scope. Specs, tests, evals and agent configuration live in the client’s repository alongside the code. For a ticketing platform, SPD Technology is the primary software engineering partner and runs agentic engineering through AI-native development teams, a setup that includes 47 custom skills, 6 subagents and 19 slash commands. Feature and bug-fix workflows pass through phased review gates and stop before PR creation, so engineers still review and approve every change.
- Economics in finance’s language. Cost of change and TCO are assessed against the client’s own baseline, which gives engineering and finance a shared language for the result. In this engagement, output nearly doubled at constant headcount while the team shipped six platform-scale initiatives at once, covering a monorepo, continuous integration, infrastructure as code, the test suite, BDD specs and full documentation.
- Verified expertise. Our specialists are Claude-certified architects. Beyond certification, hands-on work with Claude Code across development, QA, releases and production operations shapes how our engineers build production AI with Claude, from test-fidelity controls that catch weakened assertions in AI-generated tests to a Jira- and Slack-triggered AI agent orchestrator now in final rollout.
Deciding who should run your pilot? See our guide to choosing an AI development partner.
Key Takeaways
- A pilot of AI-assisted engineering without a baseline captured from system data cannot prove ROI, because any change it shows could come from the team, the scope or the season.
- Lines of code, accepted suggestions and the share of AI-written code measure activity, so a pilot judged on them reports usage as value.
- Throughput gains count only when change fail rate, rework and cycle time hold, because faster output that is fixed later borrows capacity from future sprints.
- Counting licences alone understates the cost of AI-assisted software engineering, since tokens, harness set-up, training and extra review time are part of the investment.
- A readout taken inside the early learning dip understates the return, which is why pilots need 8–12 weeks and a pre-agreed readout date.
- Scoping the engineering method (specs, tests, evals and autonomy rules) into the pilot alongside the tool is what turns gross speed into net output that survives production.
- Capacity created by AI becomes cost saved only when headcount, hiring or contractor spend actually changes, so every ROI report should state which of the two it claims.
In short: AI-assisted engineering pays back when faster output survives review and production, and a pilot proves that only with a baseline, guardrails, a full cost model and a decision rule agreed before day one.
FAQ
How do you measure the ROI of AI-assisted software engineering?
The calculation takes the engineering output at full team cost, adds in the quality savings, subtracts the full AI cost and divides by that cost. Output is defined as complexity weighted throughput taken from the system data and compared to the baseline captured prior to the pilot. That gain is only counted whilst the change failure rate, rework and cycle time are all held, as any speed that results in rework will move that cost into the following sprints and downstream processes. For that reason it’s really only a useful figure as a conservative, base and optimistic range with a payback period.
How do you pilot AI-assisted engineering?
An AI assisted engineering pilot begins with a hypothesis around a particular business constraint (e.g. a growing backlog, or increasing contractor spend) and a baseline established prior to the tool going live. You then select the work that represents the actual mix of new and legacy code and pick your comparison design (matched windows, control group or phased rollout). All the specs, tests, evaluations and autonomy rules are included in the scope of the pilot. The pilot closes with a scale, adjust or stop decision having been pre-agreed.
What metrics should I track for AI developer productivity?
Four groups of system metrics for AI developer productivity give the clearest picture:
- DORA delivery metrics (lead time, deployment frequency, change failure rate, recovery time, rework rate);
- complexity-weighted throughput per engineer;
- escaped defects and the share of changes accepted without rework;
- eval pass rates for AI features or agent workflows.
Adoption shows the pilot is running (though it’s of course of no value in itself). Sentiment acts as a friction fence in that it flags friction early on.
How long should an AI-assisted engineering pilot last?
Most AI-assisted engineering pilots need 8 to 12 weeks.
Weeks 0 to 2 set the hypothesis, baseline and guardrails, and the middle weeks run real work through the full release process, including an expected learning dip while engineers adapt and review absorbs new volume. In the last weeks, the team compares results with the baseline or control and applies the decision rule.
Shorter pilots tend to measure the learning curve, which understates the return and can cancel a method that would have paid back.
How do you know whether an AI coding pilot is working?
The AI coding pilot is working when complexity-weighted throughput rises against baseline while change fail rate, rework and cycle time stay flat or improve. Rising activity alongside rising rework is a warning sign, since the team is producing more changes and fixing more of them.
Similarly, a gain that appears only on greenfield tasks has yet to show value for the rest of the codebase. Both signals are worth checking at the mid-point gate before the final readout.
What is the first-pass success rate in AI-assisted development?
First-pass success rate is the share of changes accepted through review and automated testing without rework, so it shows whether faster output is correct the first time it reaches a reviewer.
When the rate falls while throughput rises, the team is facing the 80% problem, where generation is fast and completion is slow. In that pattern, the time saved writing code goes into reviewing and fixing it, and merged-PR counts overstate the gain. Review and CI data make it possible to track the rate weekly.
What costs belong in an AI-assisted engineering ROI calculation?
Every line the pilot adds to the budget belongs in the calculation.
- licences and seats;
- tokens or consumption;
- integration and security review;
- harness set-up (rule files, specifications, eval suites);
- training and the learning dip;
- extra review and verification time.
Licence fees are usually the smallest line. Token costs, by comparison, come from billing and scale with agent use, while review time is priced against the baseline. Leaving any of these out overstates the return.
Is capacity gained from AI the same as cost savings?
Capacity and cost savings are different things. Capacity is extra output from the same team, and it turns into cost savings only when hiring, headcount or contractor spend actually falls. Most pilots create capacity first, which finance can redeploy to the backlog or new features at the team’s loaded rate. So the ROI report should state which of the two it claims, because presenting capacity as savings can trigger a budget cut for the next fiscal year that the organization never planned.