

Platform health metrics are signals that indicate whether an engineering organization's delivery system and product are working.
Mature teams track three layers: outcome, driver, and diagnostic. Products with AI components need a fourth, AI-native layer. A dashboard green across the classic three can still fail at that fourth layer, unnoticed until a customer reports it.
The central engineering dashboard is all green: deployment frequency has increased, change failure rate has hit a record low, mean time to recovery remains within target, and system uptime has not moved. For most of the last ten years, that combination of platform health metrics has been a fair estimate of platform reliability.
Your AI-driven capabilities can degrade while every traditional telemetry signal stays green. According to the Gartner study, governance gaps identified after production incidents will lead 40% of enterprises to demote or decommission autonomous AI agents by 2027. Four metrics can help you measure the health of your AI capabilities in your current platform without rebuilding the whole infrastructure.
The Classic Layer: What Platform Health Metrics Already Cover
Traditional platform engineering measures performance through a three-level telemetry model. Outcome metrics, driver metrics, and diagnostic signals together give operational observability across deterministic architectures, and that structure remains the baseline for assessing platform health.
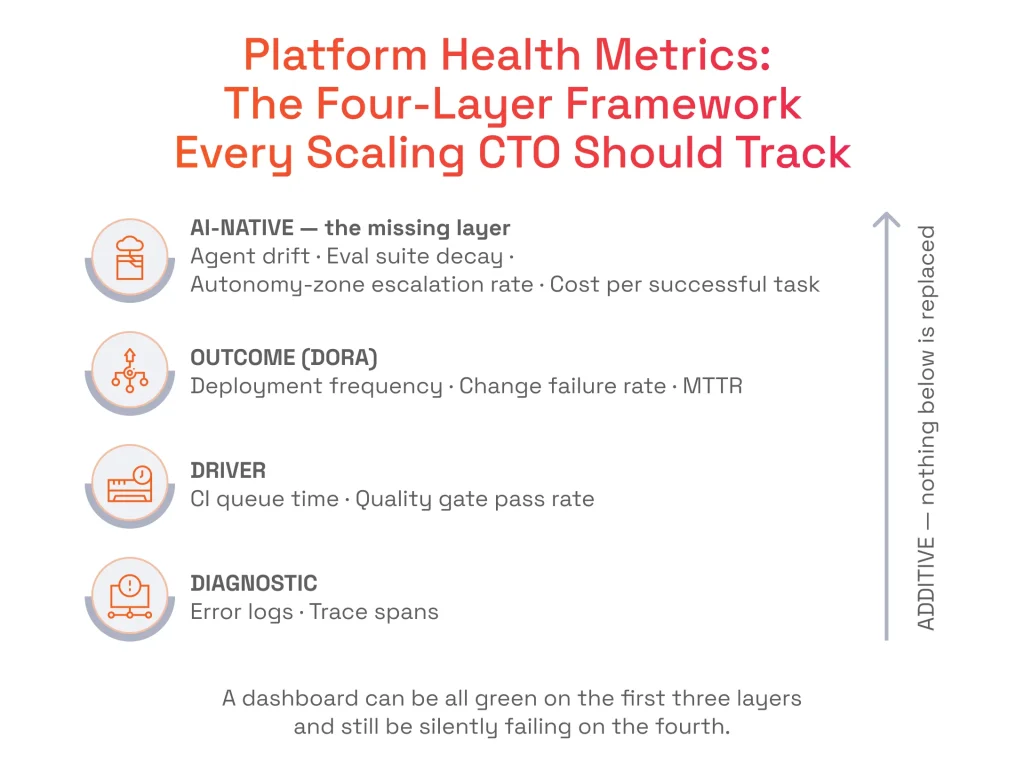
The first level includes outcome metrics: deployment frequency, change failure rate, and MTTR. They answer how often the team ships, how often a release breaks something, and how quickly the team repairs it. These are lagging indicators, dependable as a summary and useless as an early warning.
Driver metrics explain why the outcome numbers moved. CI queue time and quality gate pass rate explain the decrease in deployment frequency last month, as the pipeline was congested or the quality gate rejected more changes. Diagnostic signals such as error logs and trace spans are where incident investigations start. Their value lies in how quickly they reduce the search scope.
Traditional driver and outcome metrics yield accurate numbers only if the underlying pipeline is instrumented. Our team rebuilt the pipeline of a digital lending platform that serves more than 35 million people a month across 20+ countries and has facilitated over $1.6 billion in loans. As part of an agile transformation to a DevOps environment, we reworked CI/CD and automated testing with Jenkins, SonarQube, and Selenium until release health became measurable.
What has changed is the system these metrics describe. DORA’s 2025 research on AI-assisted software development drew on responses from nearly 5,000 technology professionals. It found that 90% are now using AI at work, and that higher adoption correlates with increases in delivery throughput and delivery instability. The classic layer registers that instability without indicating its source, because it now measures a system whose internal components behave non-deterministically.
Why AI Components Need a Fourth Layer
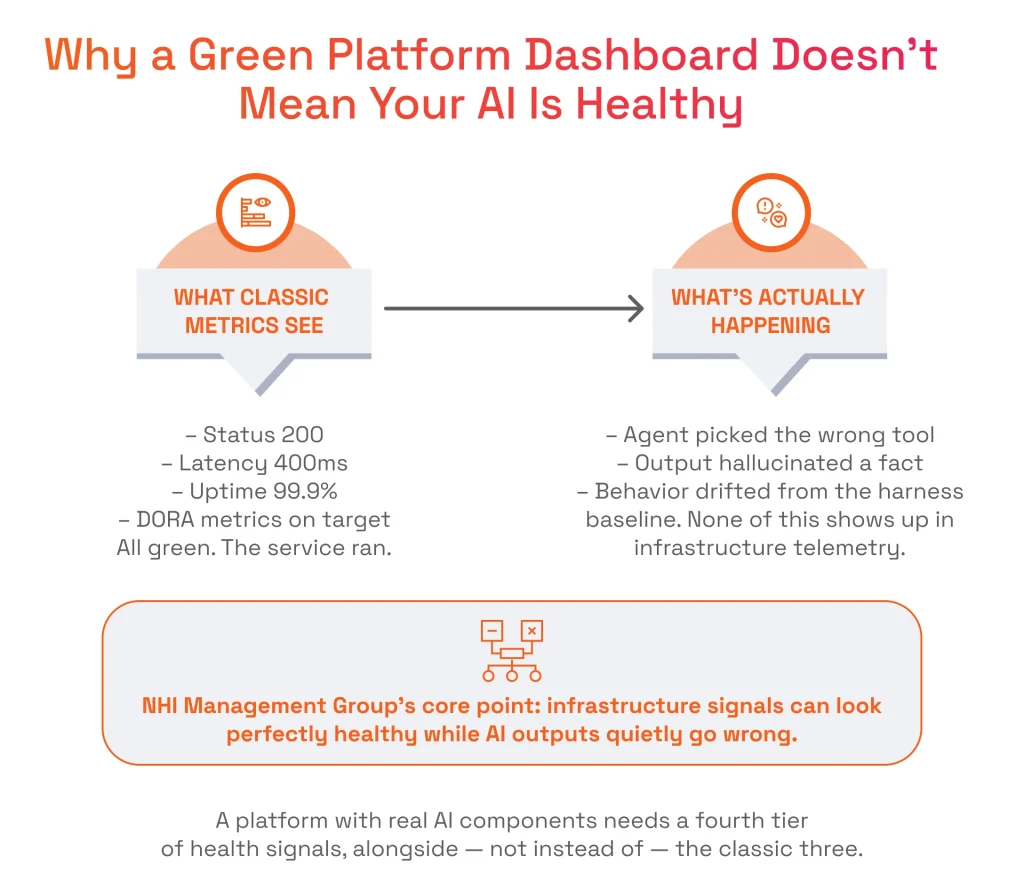
Infrastructure telemetry answers one of the most important questions: did the service run? Products with AI capabilities also need to answer another question: did the service do the right thing? Neither latency nor error-rate metrics can give you that answer. Gartner expects that 40% of organizations deploying AI will adopt specialized AI observability tooling by 2028 to monitor model performance, bias, and outputs, implying that most currently rely on instrumentation built for deterministic services.
Consider what a healthy trace actually proves. An agent completes the task with an HTTP 200 within 300 ms, and every latency budget and uptime monitor is satisfied. In that same execution loop, the agent called the wrong API tool, invented a financial figure, or deviated from its prompt. The monitoring stack reports success because, by its own definition, the request succeeded.
We built an iOS application for a US healthcare and digital medicine startup and instrumented output quality from the first release. The facial and wellness health scoring product integrates computer vision, retrieval-augmented generation (RAG), and LLMs and guarantees model accuracy above 95%. This number exists because somebody decided to measure it.
Six symptoms suggest your dashboard has gone blind to the AI layer:
- A third-party vendor changes the underlying model, but none of the metrics in your dashboard change.
- Users report hallucinated answers through support tickets before your monitoring system produces a single alert.
- Nobody can say what percentage of agent workflows are completed without human intervention.
- Inference billing increases significantly while request volume remains unchanged.
- The evaluation suite shows a perfect pass rate while users complain about a drop in answer quality.
- You update prompts in production without comparing the result against a recorded behavioral baseline.
Two of these describe a tooling gap. Four or more at once describe blindness at the intelligence layer: the dashboard proves the servers are running and says nothing about model performance. Confidence then rests on the absence of complaints, which is a lagging indicator with significant delay.
Closing this visibility gap requires adding four AI-native health signals directly alongside your existing infrastructure telemetry. These metrics track agent drift, evaluation decay, human escalation rates, and unit task costs to assess model behavior continuously. Together, they establish operational control over non-deterministic features without requiring a platform rebuild.
Agent Drift: When Behavior Changes and Nothing Alerts
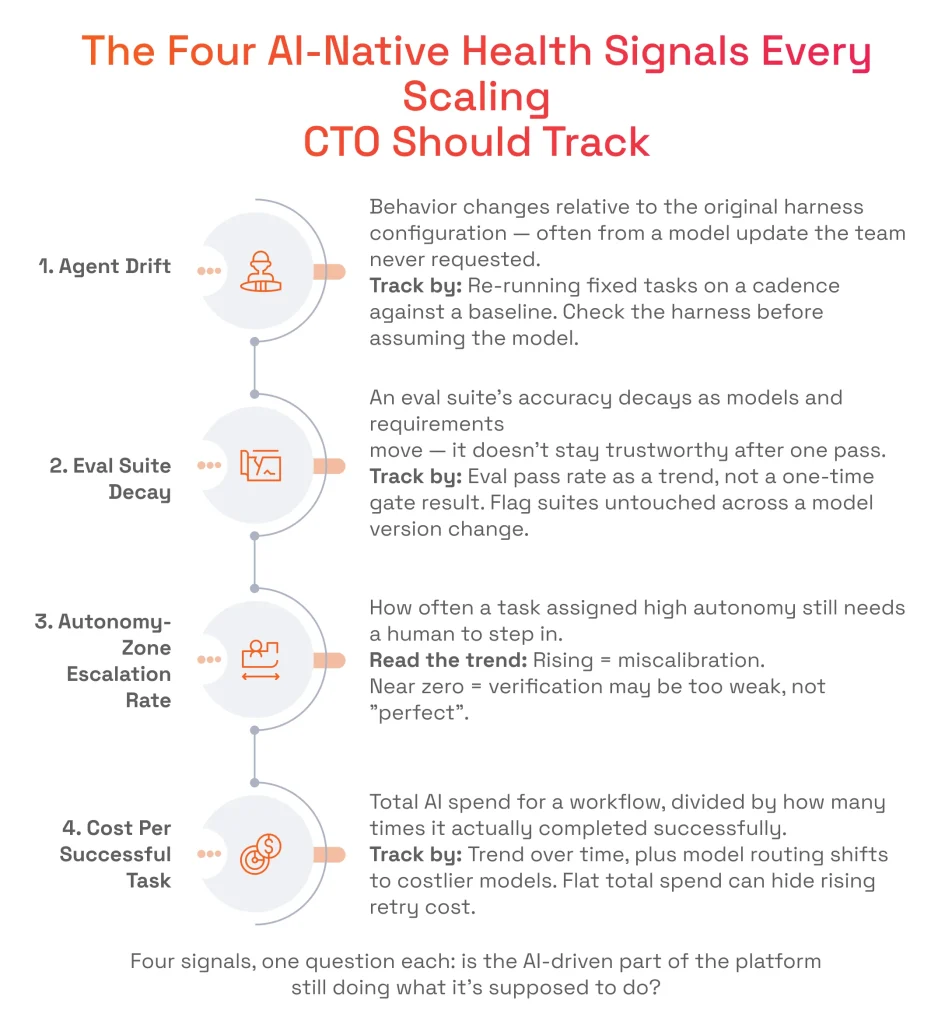
Agent drift is a change in the agent’s behavior relative to its harness configuration, frequently caused by a model update the team never requested. Infrastructure telemetry remains green throughout because there are no connection drops or memory thresholds crossed. The change is in the agent’s decision-making process.
Detection must be based on agent behavior. Run the benchmark suite on a fixed cadence, score the result against a golden baseline recorded earlier, and observe the difference between the two. The same statistical instincts used in anomaly detection with machine learning apply when observing the agent’s execution trajectory.
When deviations occur from the baseline, examine the harness before concluding that the model has degraded. Most of what developers call “the agent is getting worse” can be traced to configuration: a missing tool, a guardrail condition the model reads as ambiguous, or a noisy context window.
A 2026 whitepaper by Google on the software development life cycle describes a team moving a coding agent from outside the top 30 to the top 5 on the public Terminal Bench 2.0 leaderboard by changing only the configuration around the model. The model itself never changed. LangChain reproduced the same effect by changing the system prompts, available tools, and orchestration.
Approaching the problem with suspicion about the configuration will change what the team focuses on. Version the configuration, keep the benchmark task set in source control, and drift becomes a diff between two recorded behaviors.
Eval Suite Decay: Why a Passing Suite Stops Meaning Anything
Eval suite decay is the loss of an eval suite’s measurement accuracy as models, prompts, and product requirements evolve, so a suite that was trustworthy at launch may no longer be trustworthy after a single pass. One distinction underneath it decides everything else here.
Tests prove the correctness of deterministic code flow using precise assertions embedded in the test case. Evals check the non-deterministic components: tool selection, trajectory of multi-stage reasoning, and quality of answers against rubrics. Carefully selected golden datasets, assertion rubrics, and model judges provide scoring. A green CI build proves nothing about the second category.
Read the pass rate as a continuous trend line, with each model version marked on the same axis. That turns it from a release gate into a diagnostic signal. An unchanged suite after a major model update is no longer a useful diagnostic tool because the rubric’s calibration was based on behavior that no longer exists. A 100% pass rate alongside rising customer complaints indicates rubric decay inside the evaluation dataset.
It pays off when the metric becomes shared infrastructure. We’ve worked with a global healthcare company since 2019, providing software development and QA for DNA-sequencing machines. We automated testing three to four times faster than manual testing. Seven dev teams now use the quality dashboard.
Regulated hardware requires reproducible tests; agentic systems require tests to be continually recalibrated. But both of them require a common dashboard: a place where several dev teams see the same quality metrics for the same instrument.
Autonomy-Zone Escalation Rate: How Often Humans Still Step In
Autonomy-zone escalation rate is how often a task assigned to a high autonomy level still requires a human to step in. The metric carries diagnostic value in two opposite directions, which makes it the least intuitive of the four signals and the one most often misread.
A rising rate suggests the autonomy assignment is miscalibrated: the task was granted more freedom than the surrounding verification can cover, and humans are quietly absorbing the difference. A rate near zero looks like the goal, and rarely is.

Serhii Leleko
AI & ML Engineer at SPD Technology
“A near-zero escalation rate is the aspect I do not trust the most. Normally, the task verification is insufficient to detect mistakes that were made by the agent, so there are no escalations, and everything looks perfect in the dashboard. The level of autonomy is defined based on the level of verification, and we use the escalation rate as the indicator of that.”
To interpret both scenarios properly, we need the operation record; for that reason, the metric is the third stage in the following sequence. The delivery model assumes calibrated autonomy: each task receives a level of autonomy based on the quality of its verification and potential error costs. Humans keep architecture, security, payment, personal data, and public API contracts under control. AI handles feature implementation, refactoring, and integration, and humans verify the results.
Escalation rate shows whether a team assigned those levels correctly, turning human-in-the-loop design into a measurable platform property and keeping autonomous actions within active safety boundaries.
Roughly three incidents in ten still route to a person on Incident Pilot, an AI incident management system built for a US fintech and SaaS platform. The system autonomously resolves up to 70% of infrastructure incidents by generating PR-ready code fixes and removes the need for a 24/7 on-call rotation. Knowing which three in ten escalate is what makes the autonomy assignment defensible to a risk committee.
Cost Per Successful Task: What Your AI Infrastructure Bill Doesn’t Show
Cost per successful task is the total AI spend for a workflow divided by the number of times that workflow completes successfully. Aggregate monthly cloud spend is the number most teams watch, and the one most likely to remain flat even as unit economics deteriorate beneath it.
Model retries, long multi-agent negotiation loops, and unintended fallbacks to premium LLMs all consume budget on attempts that never finish. A workflow whose success rate falls by a third while spend holds constant has become materially more expensive per completed unit of work, and the finance dashboard still shows a straight line. Pairing spend data with model-routing visibility turns that flat line into a diagnosis a team can act on.
Per-token or per-inference benchmarks attached to a specific workflow vary by engagement. The mechanism holds without a number: unit economics per completed unit of work reveal efficiency, and aggregate infrastructure spend conceals it.
Work-unit economics also protect scalability under load. We built a serverless analytics platform for Sprocket. The B2B sales go-to-market company processes millions of historical sales records and hundreds of thousands of new entries each month with sub-two-second query latency. Its serverless design reduced API compute and frontend infrastructure costs to zero.
Unit economics and behavioral health only tell one story when they sit side by side. Put both on the same engineering dashboard, and platform governance stops being reactive.
Putting It Together: The AI-Native Platform Health Dashboard
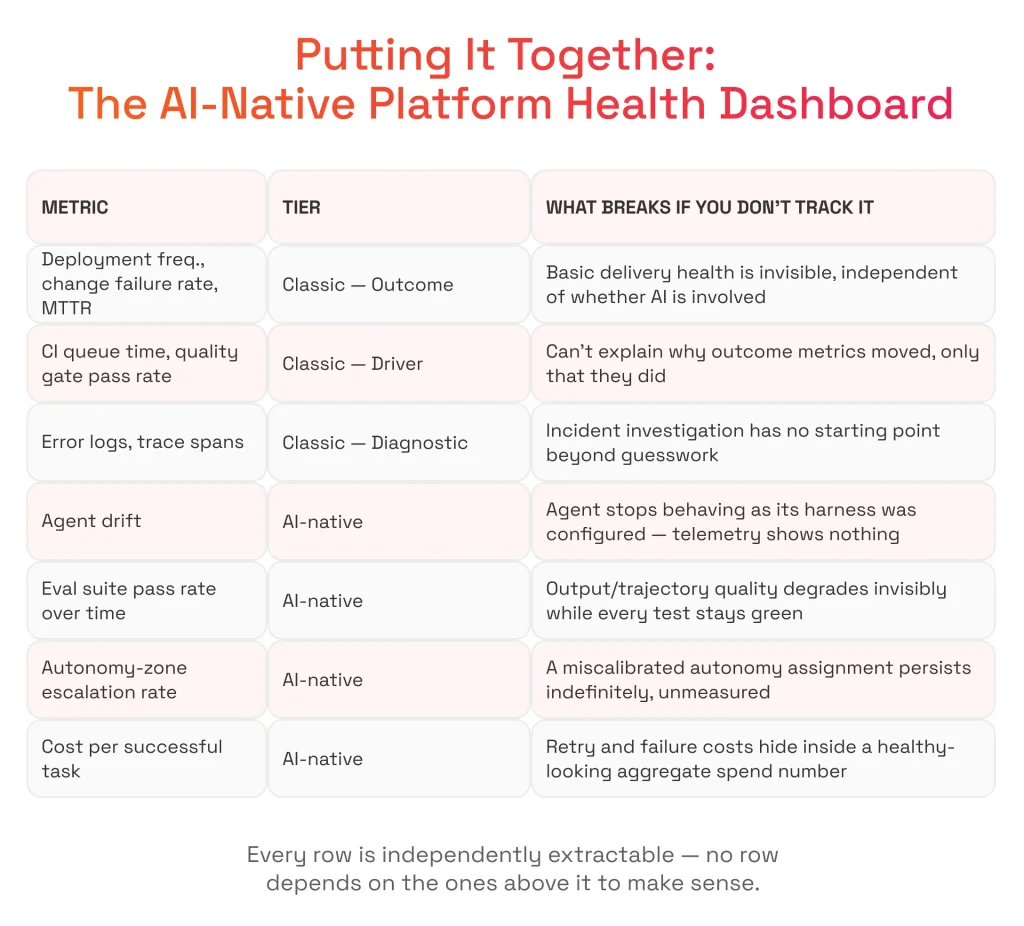
Delivery metrics and AI-native signals should live on the same dashboard. Splitting them across different tools recreates the problem the fourth layer exists to solve, because the person who reads delivery health and the person who reads model behavior end up holding different halves of one story. One surface makes the correlation impossible to ignore: a change failure rate that moves in the same week as an eval pass rate is one incident with two sides.
Metric | Tier | What Breaks If You Don't Track It | |||
|---|---|---|---|---|---|
Deployment frequency, change failure rate, MTTR | Classic: outcome | Delivery health becomes invisible, whether or not AI is involved | |||
CI queue time, quality gate pass rate | Classic: driver | Outcome metric movement can be observed but never explained | |||
| Classic: diagnostic | Incident investigation has no starting point beyond guesswork | |||
Agent drift | AI-native | An agent stops behaving as its harness was configured, and telemetry shows nothing | |||
Eval suite pass rate over time | AI-native | Output and trajectory quality degrade invisibly while every test stays green | |||
Autonomy-zone escalation rate | AI-native | A miscalibrated autonomy assignment persists indefinitely, unmeasured | |||
Cost per successful task | AI-native | Retry and failure costs stay hidden inside a healthy-looking aggregate AI spend total |
Metric
Deployment frequency, change failure rate, MTTR
CI queue time, quality gate pass rate
Error logs, trace spans Agent drift
Eval suite pass rate over time
Autonomy-zone escalation rate
Cost per successful task
Tier
Classic: outcome
Classic: driver
Classic: diagnostic
AI-native
AI-native
AI-native
AI-native
What Breaks If You Don't Track It
Delivery health becomes invisible, whether or not AI is involved
Outcome metric movement can be observed but never explained
Incident investigation has no starting point beyond guesswork
An agent stops behaving as its harness was configured, and telemetry shows nothing
Output and trajectory quality degrade invisibly while every test stays green
A miscalibrated autonomy assignment persists indefinitely, unmeasured
Retry and failure costs stay hidden inside a healthy-looking aggregate AI spend total
Read the rows together, on the cadence the team already runs. Placing driver metrics directly next to agent drift signals lets an engineer isolate the root cause in minutes: a jump in cost per successful task can be traced back to a failing quality gate or an unannounced model update. The test of a dashboard laid out this way is whether “is the AI healthy” takes the same ten seconds to answer as “is delivery healthy.”
Ownership follows the same logic as layout:
- Platform teams own the surface and the alerting thresholds.
- ML engineers own the eval rubrics and behavioral baselines that feed that surface.
- Both sign off before an autonomy level changes.
Consolidating the layers this way gives engineering leadership a single view across deterministic pipelines and probabilistic features, which helps keep scaling predictable as AI features multiply.
Getting Started: Adding the AI-Native Layer to an Existing Dashboard
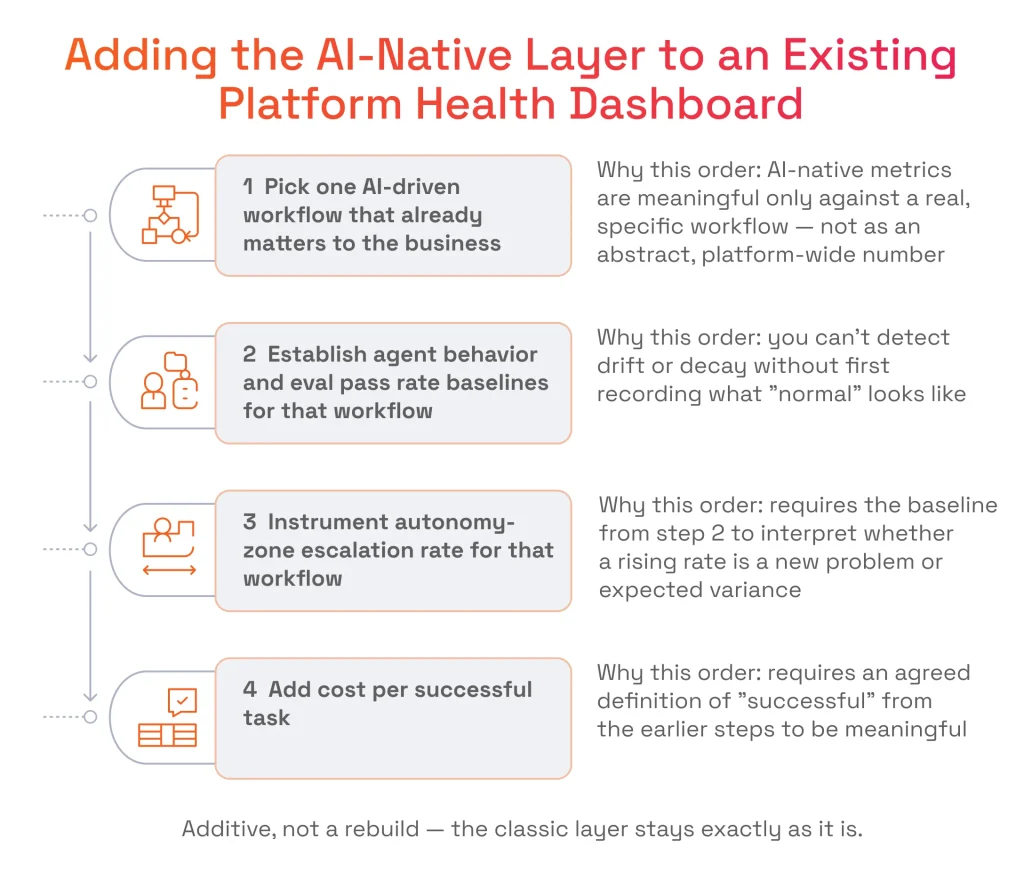
The classic layer stays untouched, and adding AI-native health metrics requires no change to an existing DORA monitoring stack. Everything here is additive, and the first version scopes to a single critical production workflow, which keeps the exercise to weeks of instrumentation on a system that already runs.
Order | Step | Why This Order |
|---|---|---|
1 | Pick one AI-driven workflow that already matters to the business | AI-native metrics are meaningful only against a real, specific workflow, never as an abstract platform-wide number |
2 | Establish agent behavior and eval pass rate baselines for that workflow | Agent drift and eval suite decay cannot be detected until normal behavior has been recorded |
3 | Instrument autonomy-zone escalation rate for that workflow | Autonomy-zone escalation rate needs the step 2 baseline to show whether a rising rate is a new problem or expected variance |
4 | Add cost per successful task | Cost per successful task needs the agreed definition of “successful” that the earlier steps produce |
Order
1
2
3
4
Step
Pick one AI-driven workflow that already matters to the business
Establish agent behavior and eval pass rate baselines for that workflow
Instrument autonomy-zone escalation rate for that workflow
Add cost per successful task
Why This Order
AI-native metrics are meaningful only against a real, specific workflow, never as an abstract platform-wide number
Agent drift and eval suite decay cannot be detected until normal behavior has been recorded
Autonomy-zone escalation rate needs the step 2 baseline to show whether a rising rate is a new problem or expected variance
Cost per successful task needs the agreed definition of “successful” that the earlier steps produce
Each step is a prerequisite for the next one, so the order cannot be altered even when leadership asks for the fourth signal first. Teams that move directly to step four find no consensus on what success means and complete step two a few weeks later. Narrowing the first attempt to one valuable workflow validates the rubric and the cost logic quickly, and the same telemetry pattern then extends to other workflows.
New health signals sit on top of an existing deployment pipeline without interfering with existing build systems. Our engineers used this gradual approach on the US FSA/HSA payments platform. The project delivered AI product eligibility classification with more than 80% accuracy across a catalog of more than 200,000 eligible healthcare products, and the platform held HIPAA and SOC 2 compliance throughout. Rebuilding the infrastructure with Terraform, AWS ECS, and GitHub Actions brought release cycles under one day.
Taking an AI build from first release to a hardened platform? Our guide to taking an AI MVP to production in 90 days maps the full path.
Platform Health Readiness Checklist
A framework is only useful if you can run it against your own dashboard. Work through the seven checks below, which cover at least one item from every tier in the table above, and tick only the practices your team can evidence today. Roadmap intentions do not count.
✓ | Practice | Implication if Missing |
|---|---|---|
⃣ | DORA metrics (deployment frequency, change failure rate, MTTR) are tracked and reviewed on a set cadence | Basic delivery health stays invisible, whether or not AI is involved |
⃣ | At least one AI-driven workflow has a recorded behavior baseline | Agent drift cannot be confirmed, leaving only a vague sense that something feels off |
⃣ | Eval pass rate is tracked as a trend across model versions | Output quality can degrade for months before anyone notices |
⃣ | Every autonomy assignment has a tracked escalation rate per task type | A miscalibrated autonomy zone persists indefinitely with no signal to correct it |
⃣ | AI cost is tracked per successful outcome alongside total spend | Retry and failure costs stay invisible inside an aggregate bill that looks fine |
⃣ |
A named owner reviews AI-native metrics on a defined cadence | Unowned signals decay in usefulness the same way an unmaintained eval suite does |
⃣ | The AI-native layer is additive to the classic dashboard | Delivery-health blind spots reappear when DORA and infrastructure metrics get deprioritized in favor of AI-specific ones |
✓
⃣
⃣
⃣
⃣
⃣
⃣
⃣
Practice
DORA metrics (deployment frequency, change failure rate, MTTR) are tracked and reviewed on a set cadence
At least one AI-driven workflow has a recorded behavior baseline
Eval pass rate is tracked as a trend across model versions
Every autonomy assignment has a tracked escalation rate per task type
AI cost is tracked per successful outcome alongside total spend
A named owner reviews AI-native metrics on a defined cadence
The AI-native layer is additive to the classic dashboard
Implication if Missing
Basic delivery health stays invisible, whether or not AI is involved
Agent drift cannot be confirmed, leaving only a vague sense that something feels off
Output quality can degrade for months before anyone notices
A miscalibrated autonomy zone persists indefinitely with no signal to correct it
Retry and failure costs stay invisible inside an aggregate bill that looks fine
Unowned signals decay in usefulness the same way an unmaintained eval suite does
Delivery-health blind spots reappear when DORA and infrastructure metrics get deprioritized in favor of AI-specific ones
A team with strong classic metrics and none of the AI-native boxes ticked usually runs a platform that looks healthy while it quietly accumulates agent drift, eval suite decay, or hidden retry costs. That gap stays invisible until a specific incident forces the question, and the incident chooses the timing.
Our Expertise
Measuring an AI platform is a different job from building one, and most teams only discover that after something ships. We have spent the last several years on both sides, and one engagement in particular put a number on the part everybody finds hardest to quantify.
Our AI incident management engagement reports a 70% autonomous resolution rate. In other words, the workflow’s autonomy zone has a tracked 30% escalation rate, and response time for a PR-ready fix dropped from 60+ minutes to under 30 minutes. That escalation figure is exactly the AI-native health signal described above: known, tracked, and used to confirm the autonomy assignment for this workflow was calibrated correctly.
- The evaluation suite ships with a maintenance path because its accuracy decays as models and requirements change.
- Harness configuration is versioned in your repository, which turns agent drift into a diff against a known baseline.
- Autonomy assignments are made per task type and verified against escalation data for that task type.
- Platform health efforts start wherever a team is: from auditing one workflow to a dashboard of all four layers.

Key Takeaways
- Traditional platform health metrics focus on measuring delivery, but healthy delivery metrics tell you nothing about the correctness of an AI feature.
- Agent drift escapes infrastructure telemetry because the agent keeps returning valid answers, so detection requires replaying a fixed task set against a recorded baseline.
- An unchanged evaluation suite over multiple model versions shows a high pass rate that does not reflect the current state of affairs and provides misleading confidence.
- An escalation rate near zero in the autonomy zone signals insufficient verification, and the number has meaning only against a baseline.
- Aggregate AI spend stays flat while retries and failed trajectories multiply, so cost per successful task exposes the degradation that a monthly total conceals.
- Instrumenting one AI-driven workflow adds a fourth layer in weeks, without rebuilding the whole platform.
In short: A dashboard built on classic delivery metrics alone will report perfect platform health while non-deterministic AI features quietly fail. The AI-native layer adds four signals to the dashboard a team already runs, and instrumenting them within a single workflow turns AI reliability from a belief into a measurement.
FAQ
What are platform health metrics?
Platform health metrics are the signals an engineering organization uses to determine whether its delivery pipeline and product function correctly. The standard combination includes three levels:
- outcome metrics like deployment frequency, change failure rate, and MTTR
- driver metrics like CI queue time and quality gate pass rate
- diagnostic signals such as error logs and trace spans.
AI platforms require an additional level because the three above confirm that the service replied without confirming that it replied correctly.
How are AI-native platform health metrics different from DORA metrics?
DORA metrics concentrate on the delivery pipeline: deployment frequency, change failure rate, and MTTR. AI-native metrics focus on the quality of the AI components running in production. The new layer is additive and does not replace anything, since deployment frequency, change failure rate, and MTTR are as important as ever. The four additional signals answer questions that DORA metrics were never designed to answer.
How much does it cost to add AI-native health metrics to an existing platform dashboard?
The price depends on three things: the number of workflows involved, the maturity of the telemetry, and whether an evaluation suite already exists. A specialized single-workflow implementation costs $15,000 to $35,000 and takes 2 to 6 weeks. Multi-workflow implementations start at $50,000 and scale with the platform footprint. Those programs cover sophisticated agent trajectories, model-judge evaluation suites, and customized FinOps routing.
How long does it take to instrument agent drift and track eval pass rate?
For a well-scoped single workflow with structured logging already in place, instrumentation typically spans 2 to 4 weeks. When you must build behavioral baselines, eval datasets, and harness versioning from scratch, the timeline extends to 6 weeks.
The timeframe depends on the project size and what already exists. The one-workflow engagement is faster than the platform-wide one. If the behavioral baselines are defined, then instrumentation is essentially wiring and tuning thresholds. Otherwise, the engagement starts with recording normal baseline behavior. Versioning the harness configuration matters too, since unversioned configuration makes drift attribution a guessing game.
What is agent drift, and how often should you test for it?
Agent drift is a shift in behavior relative to the harness configuration the agent was built against, often caused by a model update the team never requested. Establish a cadence: weekly for agents that touch revenue, customer personal data, or regulated decisions, and after each model version change.
Run the task set of interest, score it against the recorded baseline, and inspect the harness as soon as the score changes, because missing tools and vague rule files explain most score shifts.
Can existing observability tools track these four metrics?
Conventional application performance monitoring covers the classic three layers thoroughly, and no team should replace it. As for the AI layer, monitoring usually stops at token counts, latency, and error rate. These are infrastructure facts about the AI call, while the agent’s behavior stays outside the scope.
Tracking the four AI-native signals requires behavioral baselines, scoring rubrics, and a definition of a successful task — artifacts a monitoring vendor cannot supply, since they encode what correct looks like inside your product.
Who should own AI-native platform health metrics, the platform team or the ML team?
Split the ownership along the line dividing surface from semantics. Platform teams own collection, dashboards, and alerting thresholds, and make sure the AI-native layer is covered on the same cadence as the rest. ML engineers own the evaluation rubrics, the behavioral baselines, and the interpretation of what a score change means, since that interpretation requires understanding the model and the task. Autonomy-level changes need sign-off from both parties because a level reflects verification strength and business risk.