

AI-enhanced development velocity measures delivery speed net of rework, not throughput alone. It pairs the throughput metrics teams already report with first-pass acceptance rate, code churn, and cycle time to verified production. GitClear’s 2026 code-change analysis puts two-week churn 15% above 2023 levels, so throughput climbs, and hotfixes and follow-up pull requests climb with it.
Two quarters after the team adopted AI coding assistants, the sprint report looks its best in two years. Pull request volume is up, cycle time to merge is down, and every chart the engineering organization sends upward shows delivery has gotten faster. Nobody presenting it is wrong.
Hotfix volume climbed over the same two quarters, and so did the number of follow-up PRs for changes that had already shipped. Google’s 2025 DORA report on AI-assisted software development found that, across nearly 5,000 technology professionals, AI now improves delivery throughput while also increasing delivery instability. Those two trends land on separate dashboards, and almost nobody reads them together.
It is quite straightforward to understand. The cost of coding has plummeted much faster, thanks to AI, than the cost of verification; thus, productivity-based metrics overestimate the former. The sprint report does not lie about productivity. It says nothing about the price of productivity.
Velocity, after accounting for rework, is measurable. It requires a small set of metrics that consider fixes and features alike, plus a phased deployment plan that can run alongside an existing pipeline. This is not a criticism of AI-driven development, but of measuring it with pre-AI metrics.
Why Velocity Metrics Built for Human-Paced Development Break Down for AI-Assisted Code
Pull request count, story points, and cycle time to merge were designed for a time when writing code was the bottleneck, and they carried an assumption that has since expired: that a change slow enough to write, review, and merge would have real verification happening along the way.
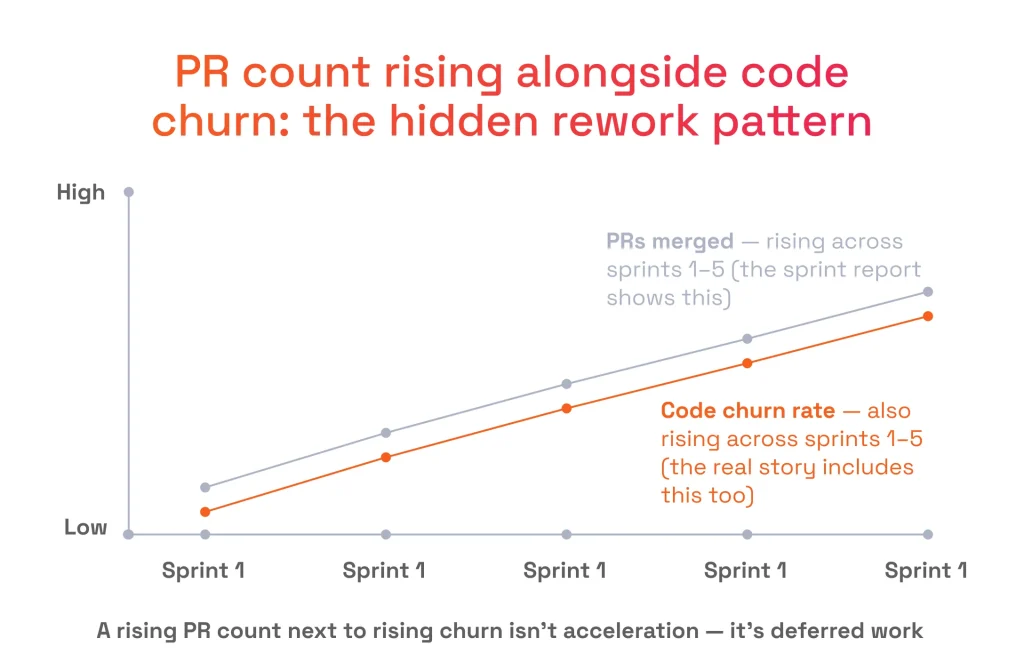
AI coding agents removed the writing bottleneck and left the verification bottleneck exactly where it was, so those numbers now track how fast plausible-looking code appears. The gap between plausible and correct is why AI-generated code breaks in production after a clean code review.
Harness called this phenomenon the AI velocity paradox: The more dependent teams were on AI coding software, the more deployment challenges they experienced, since output sped up but error-detection systems remained stagnant. Its State of DevOps Modernization 2026 research showed that 69% of those developers who used the coding tools several times per day faced deployment challenges all the time, almost always, and often enough when the code was AI-generated, and the average incident recovery time was 7.6 hours.
Harness is a platform vendor, and it measures the paradox where its own product sits inside the delivery pipeline. That places the measurement a step downstream of the cause. By the time a deployment fails, the evidence has been sitting in the codebase for days.
Rework is already an accepted delivery signal. DORA added deployment rework rate as a fifth metric in 2024 because change failure rate had been serving as a proxy for the amount of unplanned fixing a team does. The open question for DORA metrics in an AI-assisted organization is where rework gets counted, and the code layer catches it a full layer earlier than deployment data can.
An agent also quickly produces most of a feature’s surface area. The expensive remainder arrives later as a separate ticket, a hotfix, or a production incident, and it covers edge cases, integration, correctness on real data, and security. That remainder is the part traditional velocity metrics never see.
Low-structure and low-verification work measures very differently from specification-driven, evaluated work, and naive metrics reward the looser kind, which is the problem underlying moving from vibe coding to production-grade AI development. Verified velocity counts rework explicitly at the code level in the sprint when it happened.
The Verified Velocity Metrics Framework
Every traditional throughput metric hides something specific once an agent is doing the writing, and what it hides is always rework. Pair each one with a metric that counts rework directly, and AI-enhanced development velocity becomes a number that survives a second look.
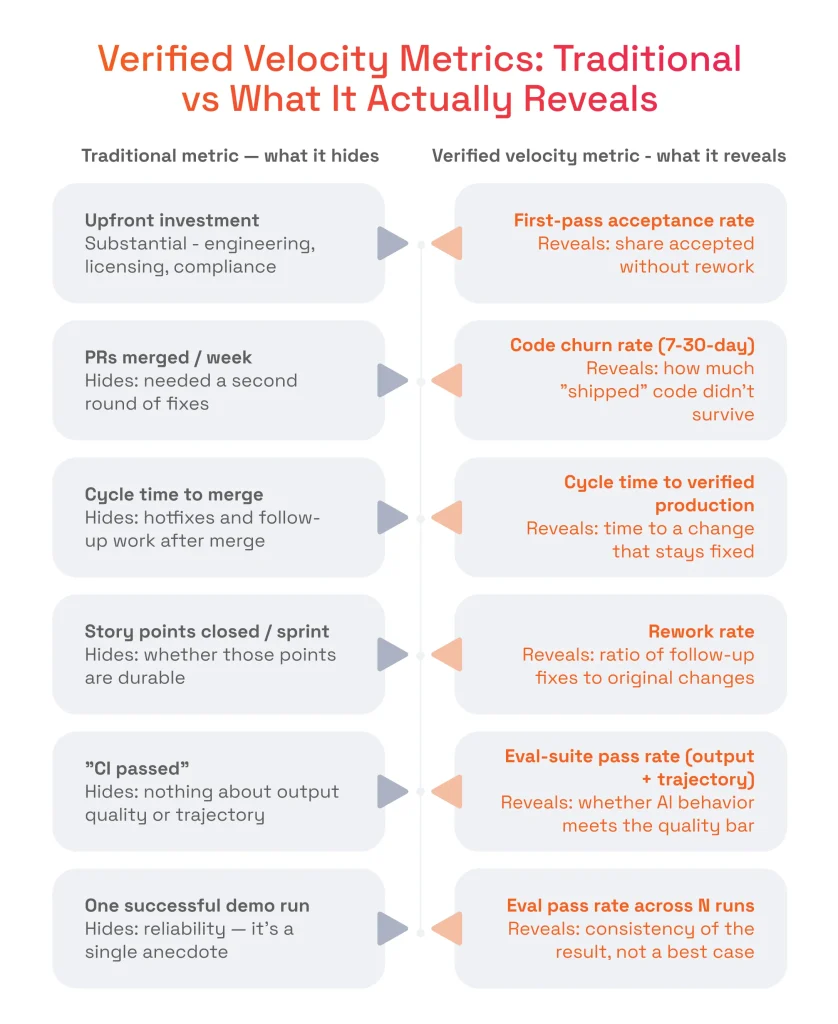
None of this replaces DORA metrics. Change failure rate and deployment rework rate still measure instability at the deployment layer, while first-pass rate, churn, and cycle time to verified production measure it at the code layer, before a change reaches a pipeline at all.
Each row below shows a metric teams already report, alongside what it leaves out.
Traditional Metric | What It Hides for AI-Assisted Code | Verified Velocity Metric | What It Reveals |
|---|---|---|---|
Pull requests merged per week | Whether the merged code came back as a second round of fixes days later | First-pass acceptance rate: share of AI-assisted changes that pass review and tests without a further round of edits | How much of what the agent produced was usable as written, rather than how much of it shipped |
Lines of code shipped | How much of that code is rewritten again within days of merging | Code churn rate: percentage of recently added or modified code rewritten within a 7- or 30-day window | How much “shipped” code did not survive contact with the codebase |
Cycle time to merge | Work still owed after merge: hotfixes, follow-up PRs, incidents opened against the change | Cycle time to verified production: time from first commit to a change that is live and has stopped generating follow-up work | How long does it take to reach a change that stays fixed, not one that is merely approved |
Story points closed per sprint | Whether those points represent durable work or work that returns next sprint under a new ticket | Rework rate: ratio of follow-up fixes to original changes in the same period | How much of the sprint’s output was spent redoing the sprint before it |
“CI passed” | Tests check deterministic behavior only and say nothing about output quality or the sequence of actions an agent took | Eval-suite pass rate, scored on output and trajectory against a written rubric | Whether non-deterministic AI behavior clears a defined quality bar, or was never checked at all |
One successful demo run | That a single success is an anecdote, not evidence of reliability | Eval pass rate across N runs on the same task set | How consistently the result repeats, rather than how good the best case looked |
Traditional Metric
Pull requests merged per week
Lines of code shipped
Cycle time to merge
Story points closed per sprint
“CI passed”
One successful demo run
What It Hides for AI-Assisted Code
Whether the merged code came back as a second round of fixes days later
How much of that code is rewritten again within days of merging
Work still owed after merge: hotfixes, follow-up PRs, incidents opened against the change
Whether those points represent durable work or work that returns next sprint under a new ticket
Tests check deterministic behavior only and say nothing about output quality or the sequence of actions an agent took
That a single success is an anecdote, not evidence of reliability
Verified Velocity Metric
First-pass acceptance rate: share of AI-assisted changes that pass review and tests without a further round of edits
Code churn rate: percentage of recently added or modified code rewritten within a 7- or 30-day window
Cycle time to verified production: time from first commit to a change that is live and has stopped generating follow-up work
Rework rate: ratio of follow-up fixes to original changes in the same period
Eval-suite pass rate, scored on output and trajectory against a written rubric
Eval pass rate across N runs on the same task set
What It Reveals
How much of what the agent produced was usable as written, rather than how much of it shipped
How much “shipped” code did not survive contact with the codebase
How long does it take to reach a change that stays fixed, not one that is merely approved
How much of the sprint’s output was spent redoing the sprint before it
Whether non-deterministic AI behavior clears a defined quality bar, or was never checked at all
How consistently the result repeats, rather than how good the best case looked
Code Churn: The Rework Signal Traditional Dashboards Don’t Track
Churn is the one rework signal that already lives in the data every team has, untouched in git history. Standard dashboards read commits as output and never ask how much of last month’s output is being rewritten this month.
To make this data meaningful, you need to know what churn is, how to interpret it for each task type, and its cost when nothing is measured.
What Code Churn Measures and Why AI-Generated Code Raises It
Churn is defined as the ratio of recent additions or changes in the codebase to the amount of code rewritten over a short period, either 7 or 30 days. “Plausible” is a good-enough attempt by agents to generate first-pass code fast.
Based on GitClear’s analysis of 623 million code changes between 2023 and 2026, churn increased by 15% compared to 2023, and refactoring line moves dropped by 70%, making developers almost 5x more likely to duplicate code than refactor it. Duplication is the quickest way to create a change that a future change will undo.
Reading Churn by Task Type
An overall churn number for the whole team is basically worthless. Payments integration churn and test scaffolding churn are very different, and averaging them provides a meaningless number. Churn breakdown by task type allows us to see which areas of development, with the help of AI, are working autonomously and which aren’t.
It should be broken down into at least architecture, feature, bug fix, integration, and routine tasks, and each line should be held for at least two sprints to draw conclusions. Otherwise, everything else but sprint noise will be considered a trend.
The Cost of Ignoring Churn
Any churn left out of the sprint where it occurs will come back as unplanned maintenance, regression, or technical debt. This is how the rapid quarter turns into the costly year: the cost of change for the impacted code increases even as the velocity chart looks rosy.
In their randomized controlled study involving 96 engineers, Google found the average AI team worked 96 minutes against 114 in the control group: a speed boost of about 21% in a large confidence interval. Its authors remark that AI may cause more churn and that code quality was never evaluated.
This is what the evidence looks like. The most rigorous measure of speed provides no information on whether the code stands up, leaving the cost of change completely unquantified in the very place that most dashboards neglect to cover. Churn is the missing metric that bridges the gap, since it is the only one that pops up at the same time as the rework.
First-Pass Acceptance Rate and Why Harness Engineering Determines It
First-pass acceptance rate is the share of AI-generated or AI-assisted changes that pass review and tests without a second round of edits. It is the clearest proxy available for how much of what an agent produced was usable as written, and it degrades quietly because a second round of edits reads as ordinary review activity on any dashboard.
What decides the number is harness engineering, the configuration surrounding the agent:
- A rules file such as AGENTS.md, carrying conventions, constraints, and the definition of done
- Tool and MCP access, scoped per task type
- Sandbox boundaries that govern what the agent can read, write, and execute
- Model routing rules for which work goes where
LangChain’s own formulation for the relationship is agent = model + harness, and its results give the claim teeth. In an experiment on harness engineering, the company moved its coding agent 13.7 points on Terminal Bench 2.0, from 52.8% to 66.5%, and from outside the top 30 to rank 5. The underlying model was held fixed, and only the system prompt, tools, and middleware changed. Teams seeing low first-pass rates usually diagnose a model problem and wait for a better release, when the surface that moved LangChain’s number is one they own outright.
Harness engineering changes should therefore be versioned and tracked directly against first-pass rate. Spec-driven development is what makes any of it measurable, since there has to be a defined “pass” before “first-pass” can measure anything. Our agentic AI development services treat that configuration surface as a deliverable.

Serhii Leleko
AI/ML Engineer at SPD Technology
“When first-pass acceptance drops, teams reach for a newer model first. In our experience, the number changes when the harness changes, whether it’s the rules file, the tool scope, or the sandbox boundary. Those determine what the agent can see and touch for a given task.Track first-pass rate against configuration versions, not just model versions, or you cannot tell which change earned the improvement.”
Tests vs. Evals: Why “CI Passed” Doesn’t Mean the Work Is Verified
Tests confirm deterministic behavior: given input X, we get output Y, and the code verifies this with a pass/fail assertion. Adopting AI doesn’t change how tests are done, which is why a fully green pipeline doesn’t mean what it did before.
Evals confirm the non-deterministic nature: they estimate output quality, tool selection, and trajectory using a labeled dataset, a scoring rubric, or model judges. Scoring of the LLM itself as a judge substitutes for human review when the latter cannot scale. The trajectory is a series of steps and tools the agent uses to generate output.
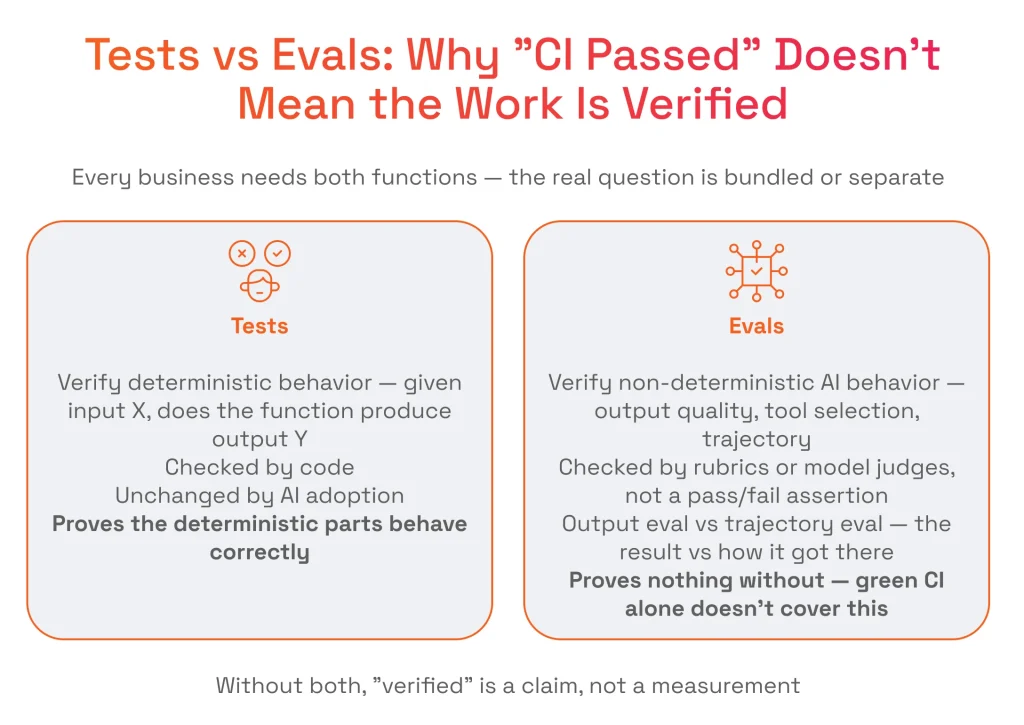
Evaluation of output and trajectory involves checking different types of problems; while a first-pass rate estimated by looking at the artifact itself may appear quite good, a problem with a trajectory will repeat for each similar task. The eval-suite pass rate should be included alongside the test suite as a release criterion, because having only one means “verified” is nothing but a lie.
Tests | Evals | |
|---|---|---|
| What they verify | Deterministic behavior: given input X, the function returns output Y | Non-deterministic behavior: output quality, tool selection, and the trajectory an agent took to reach a result |
| How they are checked | By code, with a pass/fail assertion | Against labeled datasets, written rubrics, or model judges |
| What a green result proves | The deterministic parts of the change behave correctly | The agent’s approach and output cleared a defined quality bar on this run |
Tests
- What they verify
Deterministic behavior: given input X, the function returns output Y
- How they are checked
By code, with a pass/fail assertion
- What a green result proves
The deterministic parts of the change behave correctly
Evals
- What they verify
Non-deterministic behavior: output quality, tool selection, and the trajectory an agent took to reach a result
- How they are checked
Against labeled datasets, written rubrics, or model judges
- What a green result proves
The agent’s approach and output cleared a defined quality bar on this run
Automated test coverage for regulated medical-device software has been our work at Roche since 2019, delivering 3x–4x testing time savings inside a 126-year-old pharmaceutical company of over 100,000 employees. The SQA dashboard built alongside it now serves 7 development teams, turning verification into a shared signal any team can read before release.
Calibrated Autonomy: Using Rework as the Signal for How Much AI Autonomy a Task Should Get
Calibrated autonomy is our own framework for a decision that most engineering organizations make by default: how much independent action an AI agent is given on a particular task. It matches that autonomy to the strength of available verification and the cost of a mistake, across three zones, under one governing commitment: we only automate what we can verify.
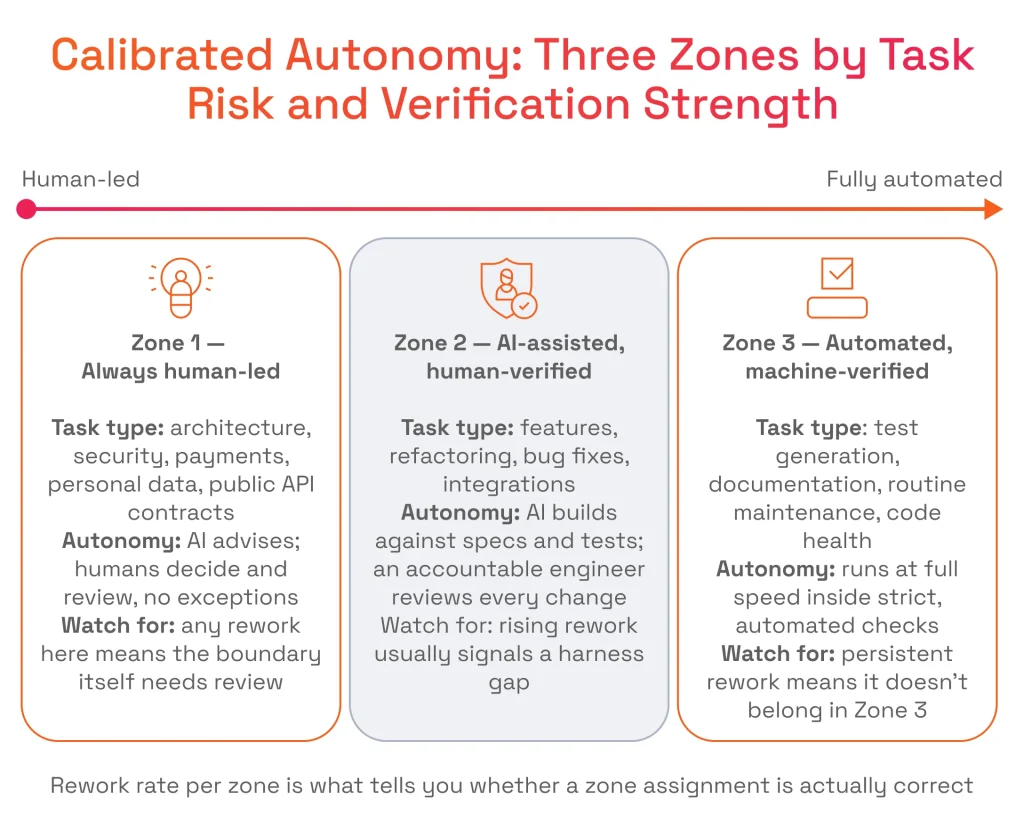
Read per zone, rework, churn, and first-pass rate tell us whether an assignment was correct, meaning that for AI-enabled development velocity, there is no single company-level number anymore. Each zone boundary is also an approval boundary; that’s where we treat human-in-the-loop as a design principle, meaning each change crossing the boundary is signed off by the named senior engineer.
Zone | Typical Task Type | Autonomy Level | Rework Signal to Watch |
|---|---|---|---|
Zone 1: Always human-led | Architecture, security, payments, personal data, public API contracts | AI advises; senior engineers decide and review every change, with no exceptions at any delivery speed | Rework should be rare here by design. Persistent rework means the zone boundary is drawn in the wrong place, not that the review is failing |
Zone 1: Always human-led | Architecture, security, payments, personal data, public API contracts | AI advises; senior engineers decide and review every change, with no exceptions at any delivery speed | Rework should be rare here by design. Persistent rework means the zone boundary is drawn in the wrong place, not that the review is failing |
Zone 2: AI-assisted & human-verified | Features, refactoring, bug fixes, integrations | AI builds against written specs and tests; an accountable engineer reviews the evidence on every change before it ships | A rising rework or reviewer-override rate points to a gap in the harness configuration or the spec, not to a limitation of the model |
Zone 3: Automated & machine-verified | Test generation, documentation, routine maintenance, code health | Runs at full speed inside strict automated checks, on work that is cheap to verify and easy to undo | Rework should trend toward zero. A task type with persistent rework has not earned Zone 3 and belongs back in Zone 2 |
Zone
Zone 1: Always human-led
Zone 1: Always human-led
Zone 2: AI-assisted & human-verified
Zone 3: Automated & machine-verified
Typical Task Type
Architecture, security, payments, personal data, public API contracts
Architecture, security, payments, personal data, public API contracts
Features, refactoring, bug fixes, integrations
Test generation, documentation, routine maintenance, code health
Autonomy Level
AI advises; senior engineers decide and review every change, with no exceptions at any delivery speed
AI advises; senior engineers decide and review every change, with no exceptions at any delivery speed
AI builds against written specs and tests; an accountable engineer reviews the evidence on every change before it ships
Runs at full speed inside strict automated checks, on work that is cheap to verify and easy to undo
Rework Signal to Watch
Rework should be rare here by design. Persistent rework means the zone boundary is drawn in the wrong place, not that the review is failing
Rework should be rare here by design. Persistent rework means the zone boundary is drawn in the wrong place, not that the review is failing
A rising rework or reviewer-override rate points to a gap in the harness configuration or the spec, not to a limitation of the model
Rework should trend toward zero. A task type with persistent rework has not earned Zone 3 and belongs back in Zone 2
Making It Auditable: The Evidence Package Behind Every Verified Release
An artifact release produces an audit trail regardless of whether anyone gathers that information or not. Our evidence package is how we collect the audit trail associated with the artifact, allowing a clear read months after release. The velocity number without an evidence package is something a board, an auditor, or an acquirer’s due diligence team can trust, but the same number with it is a measurement to check.
The package depends on something upstream. Spec-driven development means the acceptance criteria for a change are written before an agent starts work, giving the first pass something concrete to measure against and the reviewer a defined bar to check the output against. We go deeper into that practice in spec-first development for AI-assisted engineering.
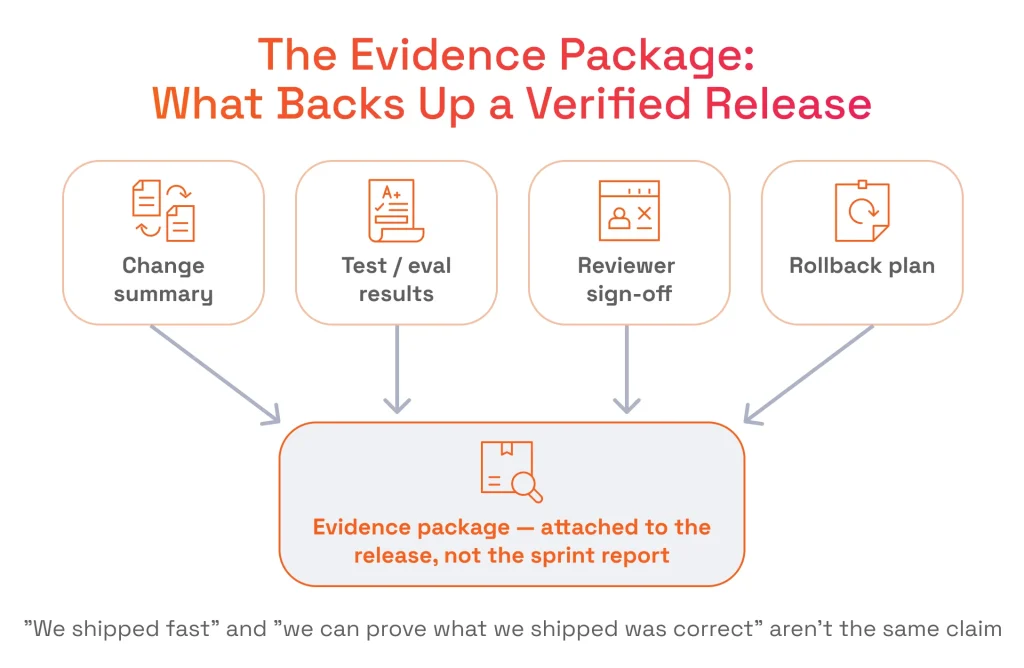
With the spec in place, a complete evidence package carries four things:
- A plain-language summary of what changed, plus the full change set
- Test results and eval results, reported separately
- Quality and security scan outcomes
- A named reviewer’s sign-off and a tested rollback plan
Merchant onboarding at Blackhawk Network fell from 7 days to under 24 hours, and 8,000+ US businesses went through the flow in 2 years. Our engineering experts built the self-service portal behind that number, automating OFAC, EIN, and SSN verification in the registration flow. Speed and verification were engineered as one discipline, the one that also carries the path from vibe-coded MVP to production system.
Rolling Out Rework-Aware Metrics: A Phased Sequence
Baselining comes first and cannot be skipped, because a team cannot show that rework was hidden without a record of what the old numbers claimed. Each phase below runs on the data produced by the previous one, so the order matters as much as the content.
Sequencing changes on a system that cannot pause is a familiar constraint. We delivered a full CI/CD pipeline and an automated testing overhaul for a digital lending platform serving 35M+ monthly users across 20+ countries and facilitating $1.6B+ in loans, staging every step on the live platform without interrupting delivery.
Order | Phase | Timeline | Relative Effort |
|---|---|---|---|
1 | Baseline the current throughput metrics as they stand: PR count, cycle time to merge, story points | 1–2 weeks | Low: mostly pulling data that the existing dashboard already produces |
2 | Derive churn and rework metrics from git history, split by task type | 2–3 weeks | Medium: scriptable against existing repositories; no new tooling required |
3 | Separate tests from evals in CI and begin scoring eval-suite pass rate against a written rubric | 3–5 weeks | Medium–high: depends entirely on whether any eval harness already exists |
4 | Bind autonomy zones to per-zone rework dashboards | 4–6 weeks | High: requires tagging work by zone consistently across the whole team |
5 | Wire a minimal evidence package into the release process | 3–4 weeks | Medium: mostly assembling data that phases 1–4 already generate |
Order
1
2
3
4
5
Phase
Baseline the current throughput metrics as they stand: PR count, cycle time to merge, story points
Derive churn and rework metrics from git history, split by task type
Separate tests from evals in CI and begin scoring eval-suite pass rate against a written rubric
Bind autonomy zones to per-zone rework dashboards
Wire a minimal evidence package into the release process
Timeline
1–2 weeks
2–3 weeks
3–5 weeks
4–6 weeks
3–4 weeks
Relative Effort
Low: mostly pulling data that the existing dashboard already produces
Medium: scriptable against existing repositories; no new tooling required
Medium–high: depends entirely on whether any eval harness already exists
High: requires tagging work by zone consistently across the whole team
Medium: mostly assembling data that phases 1–4 already generate
Verified Velocity Readiness Checklist
AI coding productivity measurement gets its real test the moment somebody outside engineering asks what a velocity number means. The eight items below pair a decision a team can make this quarter with what it changes about the answer, and the number of unticked items is the diagnostic.
-
Churn is tracked alongside PR count rather than in place of it, so rising throughput and rising rework appear together instead of the second one surfacing in the next sprint’s backlog.
-
First-pass rate is measured per task type, so a rework problem concentrated in one class of work is not averaged away by unrelated work that is going fine.
-
Tests and evals are scored and reported as separate signals in CI, so “CI passed” no longer reads as evidence that AI output quality was checked.
-
Cycle time is measured to verify production; therefore, deferred rework appears as elapsed time rather than as another ticket opened later.
-
Rework is read per autonomy zone, so each assignment can be fixed based on its data rather than the engineer’s discretion.
-
Eval suite includes the output of the AI-generated product that cannot be calculated deterministically, so quality becomes measurable by a defined pass/fail criterion rather than a spot check.
-
Each release has its evidence package; therefore, a velocity claim stands verified by someone who wasn’t in the room: change set, test and eval results, approval, and rollback plan.
-
Harness engineering changes are logged against first-pass rate movements, so you can trace an improvement or regression in agent output to the change that caused it.
A team that ticks every throughput box and a few of the verification ones usually has a rework problem, wearing a good sprint report. Three or more unchecked items outside the baseline throughput metrics indicate that the next engineering investment should go into measurement infrastructure rather than more AI tooling.
How We Build Measurement Into AI-Assisted Delivery: SPD Technology’s Expertise
Verified Velocity is our own delivery framework for AI-assisted engineering, built on three pillars: Velocity, Verification, and Accountability. It governs how our teams work day-to-day, ahead of any reporting layer built on top of it.
In practice, the framework comes down to three things:
- Autonomy zones set how much independent action an agent gets on a given task.
- Tests and evals are gated separately in CI, so a green pipeline never stands in for output quality.
- Every release ships with its own evidence, and a named senior engineer approves it and can explain what changed, why it is safe, and how to roll it back.
That discipline is what makes the questions investors ask about AI development answerable with data.
Autonomous AI Resolution With a Measured Escalation Rate: AI Incident Management
A US fintech and SaaS platform needed incident response that did not depend on staffing a 24/7 on-call rota across time zones. We built an agentic incident management system that detects an incident, analyzes it, and delivers a pull-request-ready fix, cutting response time from over 60 minutes to under 30 with up to a 70% successful autonomous AI resolution rate.

The system reports the automation rate alongside the share of incidents that are correctly escalated, so escalation remains a measurable signal rather than an unknown.
Automated Verification Built Into Onboarding Throughput: Aggregated Merchant Portal
Checks for OFAC, EIN, and SSN verification carried the weight of compliance in the aggregate merchant portal, embedded in the registration process and automatic for every application submission. This approach allowed 8,000+ US-based businesses to sign up over two years, cutting a process that used to take seven days to less than 24 hours. Compliance-by-design scales to regulated industry contexts when those checks sit in the middle of the critical path.

Most teams do not lack AI tooling. They lack the AI coding productivity measurement layer that tells them whether the tooling is working, and our engineering team can run a rework and velocity audit against an existing pipeline within weeks.
Key Takeaways
- Pull request or cycle-time-to-merge count is going up because of more hotfix and follow-up PRs, which counts as rework instead of speed.
- Code churn is the ratio of recently released code rewritten again over the past few days, and it is the best metric available in git for detecting unfinished work generated by AI.
- A green CI pipeline proves that the deterministic parts of a change behave correctly and leaves output quality and tool-use trajectory to an eval suite.
- First-pass acceptance rate moves further on harness engineering changes than on a switch to a newer underlying model, and the changes that move it are rules files, tool access, and sandbox boundaries.
- Reading rework rate team-wide instead of per calibrated-autonomy zone hides the signal that identifies which zone assignments are wrong.
- A velocity number without an evidence package is a claim a diligence reviewer has to trust, and the package that turns it into a measurement holds the change set, test and eval results, reviewer sign-off, and a rollback plan.
- Cycle time to deployment with verification ensures rework isn’t hidden as an incomplete task for the next sprint.
In short: AI-assisted development velocity can only be real if rework metrics are measured together with productivity; otherwise, faster delivery times will show progress that does not exist yet without first-pass acceptance rate, code churn, and evaluation suite pass rate.
FAQ
What is code churn, and why does it matter more for AI-generated code?
Churn is the percentage of recently added or modified code rewritten within a 7- or 30-day window. It matters more with agents in the loop because they quickly produce a plausible first pass, and “plausible” is not correct for a specific codebase’s conventions, edge cases, and hidden dependencies. A team tracking only PR count can look highly productive, even as a large share of that output is quietly being rewritten.
What’s the difference between tests and evals when measuring AI-assisted development?
Tests verify deterministic behavior, checked by code with a pass/fail assertion, and AI adoption doesn’t change how they work. Evals verify non-deterministic behavior. They score output quality, tool selection, and trajectory against labeled datasets, rubrics, or model judges. A CI pipeline that runs only tests can be entirely green while the AI-generated portion of a change fails on quality or approach.
How long does it take to get a rework-aware view of velocity?
The first usable signal arrives in roughly 3–5 weeks: a throughput baseline, followed by churn and rework metrics derived from git history. Separating tests from evals in CI adds another 3–5 weeks and depends on whether any eval harness exists today. The full five-phase sequence, through per-zone dashboards and minimal release evidence, runs 13–20 weeks.
How is rework rate different from cycle time?
Cycle time measures how long it takes for a change to move through the pipeline. Rework rate measures how much of that work had to be redone, as the ratio of follow-up fixes to original changes, regardless of how fast the original moved. A team can hold an excellent cycle time and a poor rework figure at once, which is what makes raw velocity numbers misleading from the outside.
How much does it cost to add rework-aware metrics to an existing pipeline?
Most of the cost is engineering time. Phases 1 and 2 run on data the team already has, so nothing new has to be bought to start. Across all five phases, the sequence typically takes 13–20 engineering weeks, or roughly 520-800 engineer-hours, usually with one or two engineers part-time plus a lead for autonomy-zone tagging.
One range covers most cases: $16,000 to $72,000 for the whole sequence. Offshore and nearshore delivery sits at the bottom of that band, and in-house US engineering at the top, where a fully loaded engineering week runs around $3,600.
Tooling is the smaller line. Engineering intelligence platforms that report DORA and churn metrics publish per-seat pricing from roughly $9 to $50 per developer per month, so a 100-engineer organization looking to buy rather than script would add $11,000 to $60,000 a year.
Eval infrastructure is the real variable. Teams with no eval harness will spend the largest share of the 13–20 weeks on phase 3, and teams with one already running often finish the whole sequence at the bottom of the range.
Do DORA metrics still work for AI-assisted development?
Yes, and DORA has already adapted. The current model groups five metrics into two factors. Software Delivery Throughput covers change lead time, deployment frequency, and failed deployment recovery time. Software Delivery Instability covers change fail rate and deployment rework rate, the fifth metric, added in 2024.
DORA metrics measure rework at the deployment layer, and churn and first-pass rate measure the same phenomenon at the point code is written.
What is the “AI velocity paradox,” and how is it different from rework rate?
It is a term coined by Harness, based on the company’s own survey research, describing how teams adopting AI coding tools most heavily also report the most frequent deployment problems and the longest incident recovery times. Harness measures it at the pipeline and operations level, where its platform sits. Churn and follow-up-fix ratios capture the same phenomenon one layer earlier, as code is written and reviewed.
How does calibrated autonomy relate to measuring AI development velocity?
Calibrated autonomy is our framework for matching the level of independent action an agent gets on a task to the strength of available verification and the cost of a mistake, structured into risk-based zones. Rework, churn, and first-pass rate read per zone reveal whether an assignment is correct, which is what makes AI-enhanced development velocity meaningful at the task level. Rising rework in a supposedly low-risk zone is the signal to tighten verification there.