

When you try to stretch a risk monitoring system built for a few hundred merchants to handle several thousand, it quickly falls apart. This leaves teams drowned in endless alerts, blind to critical trend context, and buried under manual compliance paperwork. To handle this scale, you need a system with a mature setup that constantly pulls in fresh data from multiple sources and uses machine learning to rank threats so your team only focuses on what actually matters. By tracking how each merchant typically operates, the system triggers targeted, automated responses and handles compliance paperwork like VAMP or MATCH to save your team the headache.
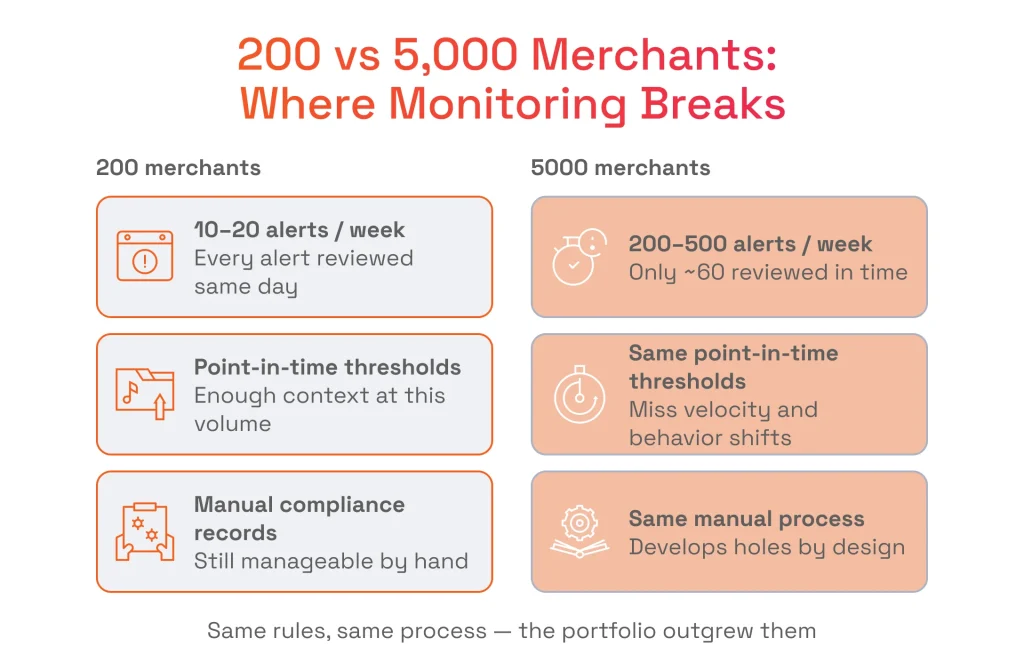
Picture a risk team responsible for 4,000-5,000 merchants. Their system fires 200 alerts a week, and analysts get through about 60 in time for the response to matter. The rest sit in a queue until they auto-close or resurface in the chargeback report. In this situation, it is easy to blame an underperforming team, since that is the obvious explanation at first sight. But in reality, the culprit is a monitoring architecture built for a portfolio one tenth the size.
An architecture that has not scaled with the portfolio fails the business, because the threat itself keeps growing. The FTC recorded roughly $16 billion in reported fraud losses in 2025, the highest total on record and about 25% above 2024, and a meaningful share of that fraud moves through merchant accounts that platforms are expected to catch. This article examines why the approach to merchant risk monitoring that works at 100 merchants collapses at 5,000, and what replaces it.
Where Small-Scale Merchant Risk Monitoring Breaks Down
At 200 merchants, monitoring runs on three habits, namely humans review alerts as they arrive, thresholds check numbers at one point in time, and compliance records built by hand. These habits carry a platform through the early stages of merchant lifecycle management, but each one breaks as the portfolio grows, and most platforms mistake the breakage for a staffing gap.
Failure Mode 1: Alert Volume and Alert Fatigue
A rules-based system fires whenever a metric crosses a threshold. At 200 merchants, that produces 10-20 alerts per week, each getting a same-day review. At 5,000 merchants, the same rules dump 200-500 alerts on three to five analysts, far more than any team can genuinely investigate.
Alert fatigue makes review selective in ways that have nothing to do with risk. Whatever tops the queue gets attention first, so a dangerous signal waits behind two dozen routine threshold crossings that arrived earlier. Volume also wears down trust in the alerts themselves, as analysts who have closed hundreds of false positives in a category stop scrutinizing it closely.
As a result, platforms in this state learn about their most serious risk events after the damage is already done, through the chargeback report or a card network notice.
Failure Mode 2: Missing Velocity and Behavioral Context
Consider two ways a merchant can hit the same 1% chargeback alert. One jumps from 0.3% to 1.1% overnight, most likely one large dispute, already contained. The other climbs there steadily over six weeks and is still accelerating toward a card network program. The alert fires identically either way.
A rules engine cannot tell them apart. It checks whether a metric is above the line right now, and both are. Whether the number has been climbing, and how fast, never gets asked. It’s the same story with baselines, they have the same blind spot. A merchant processing $50K a month for a year suddenly pushes through a $500K transaction. No threshold trips, yet everything about it is abnormal for this account.
So the system fails in both directions. It misses the deterioration that hurts platforms and floods the queue with blips that would have resolved on their own. The blips feed alert fatigue, and the misses feed the chargeback report.
Failure Mode 3: Compliance Documentation as a Manual Process
Every risk action against a merchant comes with paperwork. Cut a processing limit, suspend an account, submit to MATCH, or file a SAR, and someone must record which signal triggered the review, what evidence was gathered, who decided what and when, and what the merchant was told. Done by hand, at dozens of actions a month, that record develops holes by design.
The trouble is, the cost of each hole is steep. A missed MATCH submission lets a fraudulent merchant resurface on another platform. A SAR filed late because the evidence took two weeks to compile is a violation in its own right. A suspension with no complete evidence trail turns into legal exposure the moment the merchant disputes it.
At a small scale, documentation is a discipline. At portfolio scale, it has to be something the system produces, or something will eventually get missed.

Olexandr Boyko
Delivery Director at SPD Technology
“Clients rarely come to us asking to rethink their monitoring. They ask for a patch, more alert rules, a better dashboard, an extra report. Then we look inside the system and find no trend data, no baselines, and no audit trail. What needs fixing is not the dashboard, it is the design underneath it.”
What Changes: The Architecture of Merchant Risk Monitoring at Scale
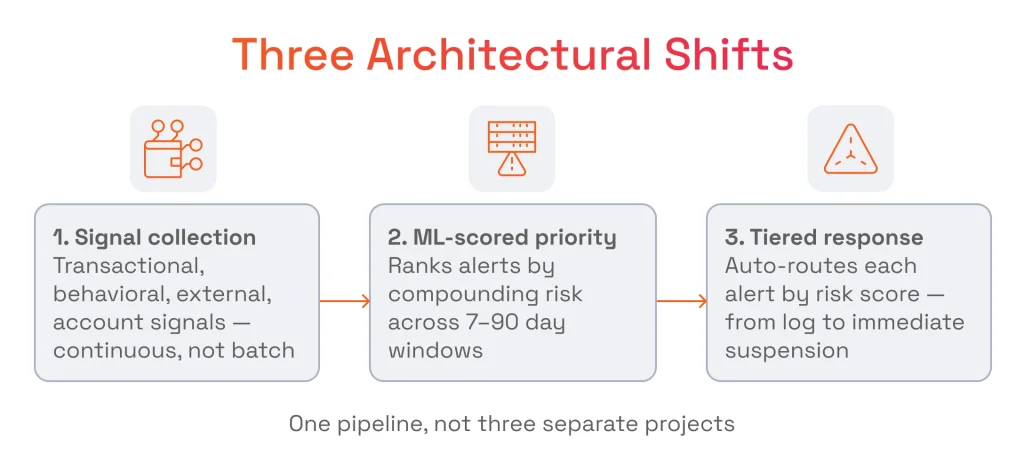
When architecture undergoes a deliberate redesign, the business no longer deals with more rules or more reviewers. Instead, it sees changes in how signals are gathered, how alerts are ranked, and how responses are executed.
AI and ML are what drive all three changes, and organizations are already putting it to work. This shift toward machine learning in banking is backed by data: Oliver Wyman’s 2026 CRO Outlook Survey found that 54% of banks have adopted AI in production, with another 48% planning to deploy it in risk functions within two years.
Architectural Shift 1: Continuous Multi-Source Signal Collection
Scale-ready architecture relies on continuous data ingestion rather than batch processing. To evaluate multi-source streams simultaneously, the pipeline ingests, cleans, and normalizes disparate data into a unified schema:
- Real-time transactional events: Authorization failures and ticket-size swings.
- Periodic external indicators: Web crawls and third-party API feeds for adverse media.
- Event-driven account changes: Updates to bank routing numbers or beneficial ownership.
To detect true anomalies versus seasonal surges, the engine establishes a behavioral baseline for each merchant. New merchants start on generic Merchant Category Code (MCC) and regional baselines, which automatically transition into tailored, rolling historical baselines as processing history grows.
Here is how a scale-ready architecture structures and maps these multi-source signals.
Signal Category | Signal Type | Source | Update Frequency | Risk Indicator |
|---|---|---|---|---|
Transactional | Chargeback ratio (volume and count) | Card network / acquirer data feed | Daily / T+1 | Exceeds Visa VAMP (0.9%) or Mastercard (1%) threshold; accelerating trend over 4+ weeks |
Transactional | Refund rate | Payment processor data | Real-time / near-real-time | Refund rate > 2x merchant baseline or > 10% of transaction volume |
Transactional | Average ticket size deviation | Transaction data | Real-time | Single transaction > 3x 90-day average; sustained shift in ticket distribution |
Transactional | Transaction velocity | Transaction data | Real-time | Transaction count per hour / day > 2x baseline; sudden velocity spike without prior volume growth |
Behavioral | Time-of-day processing pattern | Transaction data | Daily (rolling baseline) | Processing concentration in unusual hours for merchant’s MCC; sharp shift from established pattern |
Behavioral | Geographic distribution | Transaction / IP data | Real-time | New countries or regions in transaction origin without corresponding business expansion |
Behavioral | Payment method mix | Transaction data | Weekly (rolling baseline) | Sudden shift from established card type mix; new payment method adoption without onboarding trigger |
External | News and adverse media | Web monitoring / news APIs | Continuous (crawl frequency) | Negative press coverage, regulatory action, court filings, social media fraud complaints |
External | Sanctions list changes | OFAC, EU sanctions, national lists | Daily / real-time feed | Merchant, beneficial owner, or associated entity appears on updated sanctions list |
Account | Bank account change request | Platform event log | Event-driven | Bank account change combined with increased transaction volume; change to newly opened account |
Account | Login anomaly | Authentication logs | Real-time | Unusual login location, new device, failed authentication attempts followed by success |
Account | Beneficial owner update | KYB event | Event-driven | Ownership change to unknown or high-risk individual; combined with processing pattern change |
Signal Category
Transactional
Transactional
Transactional
Transactional
Behavioral
Behavioral
Behavioral
External
External
Account
Account
Account
Signal Type
Chargeback ratio (volume and count)
Refund rate
Average ticket size deviation
Transaction velocity
Time-of-day processing pattern
Geographic distribution
Payment method mix
News and adverse media
Sanctions list changes
Bank account change request
Login anomaly
Beneficial owner update
Source
Card network / acquirer data feed
Payment processor data
Transaction data
Transaction data
Transaction data
Transaction / IP data
Transaction data
Web monitoring / news APIs
OFAC, EU sanctions, national lists
Platform event log
Authentication logs
KYB event
Update Frequency
Daily / T+1
Real-time / near-real-time
Real-time
Real-time
Daily (rolling baseline)
Real-time
Weekly (rolling baseline)
Continuous (crawl frequency)
Daily / real-time feed
Event-driven
Real-time
Event-driven
Risk Indicator
Exceeds Visa VAMP (0.9%) or Mastercard (1%) threshold; accelerating trend over 4+ weeks
Refund rate > 2x merchant baseline or > 10% of transaction volume
Single transaction > 3x 90-day average; sustained shift in ticket distribution
Transaction count per hour / day > 2x baseline; sudden velocity spike without prior volume growth
Processing concentration in unusual hours for merchant’s MCC; sharp shift from established pattern
New countries or regions in transaction origin without corresponding business expansion
Sudden shift from established card type mix; new payment method adoption without onboarding trigger
Negative press coverage, regulatory action, court filings, social media fraud complaints
Merchant, beneficial owner, or associated entity appears on updated sanctions list
Bank account change combined with increased transaction volume; change to newly opened account
Unusual login location, new device, failed authentication attempts followed by success
Ownership change to unknown or high-risk individual; combined with processing pattern change
Architectural Shift 2: ML-Scored Alert Prioritization
Chronological triage queues drive backlogs by sorting alerts by time rather than severity. Scale-ready platforms replace flat models with ML scoring engines that dynamically rank alerts by compounding risk, part of a broader shift toward AI in fraud detection across payment platforms.
Unlike rigid rules engines checking single thresholds, machine learning models analyze complex signal combinations across 7-to-90-day windows. To solve black-box interpretability, production systems utiliz AI decision intelligence frameworks to surface the top 3-5 contributing factors directly in the analyst dashboard. Pairing behavioral ML-driven anomaly detection with models dedicated directly to fraud detection with machine learning creates clear audit trails and enables platforms to scale safely without expanding headcount.
Architectural Shift 3: Tiered Response Automation
Uniform manual review causes operational bottlenecks by routing low-severity threshold crossings through the same pipeline as critical threats. A scaled architecture resolves this by implementing a tiered response framework that automatically routes and acts on alerts based on their ML risk scores.
Tier | Risk Score Range | Signal Characteristics | Automated Response | Human Action Required |
|---|---|---|---|---|
Tier 1 — Informational | 0–30 | Single metric at low threshold; no trend; no co-occurring signals | Log event; update merchant risk record; no alert sent to analyst | None — system handles automatically; reviewed in periodic portfolio audit |
Tier 2 — Watch | 31–55 | Single metric approaching threshold; or early trend signal; or external signal without transaction confirmation | Add merchant to enhanced monitoring; increase signal collection frequency; flag in weekly portfolio review | Risk analyst reviews in weekly batch; no immediate action required |
Tier 3 — Elevated | 56–75 | Metric at or above threshold; or confirmed trend over 2+ weeks; or two co-occurring signals | Automated alert to risk analyst with prioritized queue placement and signal summary; draft communication to merchant prepared automatically | Risk analyst reviews within 2 business days; decides on action (limit reduction, outreach, continued monitoring) |
Tier 4 — High Risk | 76–90 | Multiple co-occurring signals; confirmed trend with acceleration; or single critical signal (MATCH-triggering pattern, OFAC proximity) | Immediate alert to risk team lead with full signal package; processing limit automatically reduced to 50% pending review; merchant account flagged in payment system | Risk team lead reviews same business day; compliance team notified; action decision documented |
Tier 5 — Critical | 91–100 | OFAC match; confirmed fraud pattern; or chargeback ratio triggering network termination threshold | Immediate account suspension; POS terminals deactivated; risk team and compliance team alerted simultaneously; MATCH evaluation triggered automatically | Immediate response required; compliance documentation initiated automatically; senior risk officer decision within same business day |
Tier
Tier 1 — Informational
Tier 2 — Watch
Tier 3 — Elevated
Tier 4 — High Risk
Tier 5 — Critical
Risk Score Range
0–30
31–55
56–75
76–90
91–100
Signal Characteristics
Single metric at low threshold; no trend; no co-occurring signals
Single metric approaching threshold; or early trend signal; or external signal without transaction confirmation
Metric at or above threshold; or confirmed trend over 2+ weeks; or two co-occurring signals
Multiple co-occurring signals; confirmed trend with acceleration; or single critical signal (MATCH-triggering pattern, OFAC proximity)
OFAC match; confirmed fraud pattern; or chargeback ratio triggering network termination threshold
Automated Response
Log event; update merchant risk record; no alert sent to analyst
Add merchant to enhanced monitoring; increase signal collection frequency; flag in weekly portfolio review
Automated alert to risk analyst with prioritized queue placement and signal summary; draft communication to merchant prepared automatically
Immediate alert to risk team lead with full signal package; processing limit automatically reduced to 50% pending review; merchant account flagged in payment system
Immediate account suspension; POS terminals deactivated; risk team and compliance team alerted simultaneously; MATCH evaluation triggered automatically
Human Action Required
None — system handles automatically; reviewed in periodic portfolio audit
Risk analyst reviews in weekly batch; no immediate action required
Risk analyst reviews within 2 business days; decides on action (limit reduction, outreach, continued monitoring)
Risk team lead reviews same business day; compliance team notified; action decision documented
Immediate response required; compliance documentation initiated automatically; senior risk officer decision within same business day
With the automation of low-tier actions, platforms can significantly reduce manual overhead. Automating responses for Tier 1 and Tier 2 events can remove around half of the daily alert volume from the analyst queue. This structural shift changes team capacity from routine filtering to high-stakes investigations where human-in-the-loop review is absolutely necessary.
Furthermore, the system must trigger automated documentation workflows at every level above Tier 1. When a Tier 4 or Tier 5 event occurs, the engine automatically compiles the underlying transaction logs, velocity charts, and baseline comparisons into a standardized compliance file. This ensures that if the account must be terminated for cause, the necessary evidence is already organized and ready for submission.

Olexandr Boyko
Delivery Director at SPD Technology
“The mistake we see most is treating these three shifts as separate projects. Signal collection, scoring, and response automation only work as one pipeline. Build them in isolation and you end up with a great model reading bad data, or a great tier system acting on a score nobody trusts.”
Card Network Compliance at Scale: VAMP, MATCH, and What the Monitoring System Must Automate
At portfolio scale, payment processing compliance moves from a recurring operational check to a high-stakes engineering requirement. Card networks and regulatory bodies enforce strict, quantitative programs that punish systematic monitoring gaps. If a platform relies on manual workflows to review alerts, it will struggle to meet the strict enforcement timelines mandated by global payment ecosystems.
Visa VAMP and Mastercard Chargeback Programs — What the Thresholds Actually Require
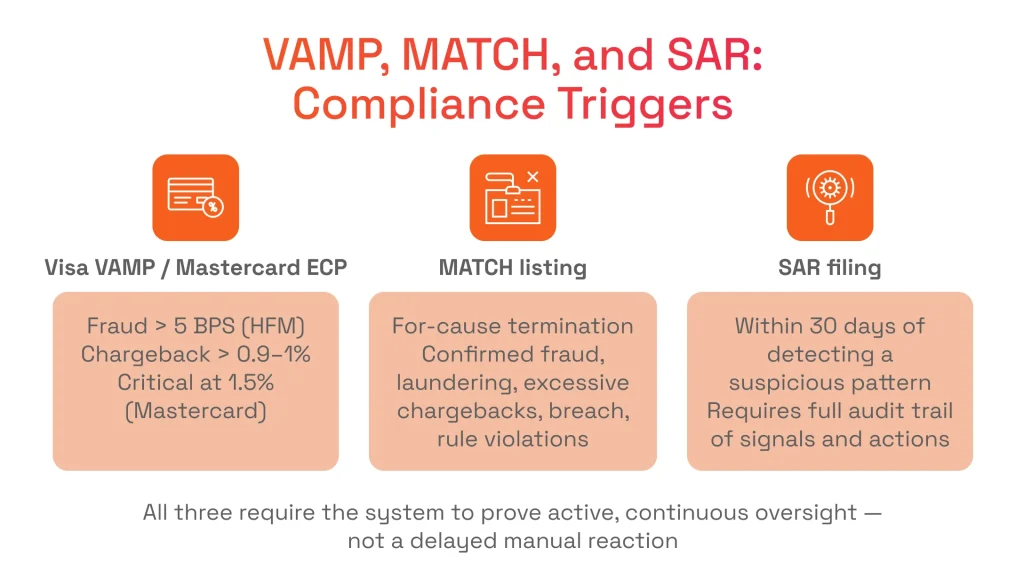
The Visa Acquirer Monitoring Program (VAMP) places acquirers and payment facilitators under strict observation if fraud or dispute rates cross set limits. As outlined in the official Visa VAMP Global Framework, the program tracks dynamic risks using two primary criteria, both built on rigorous credit card fraud detection logic:
- High Fraud Merchant (HFM) metric (triggers when fraud basis points exceed 5 BPS on Visa transaction volume);
- High Chargeback Merchant (HCM) metric (applies to accounts exceeding a 0.9% chargeback-to-transaction ratio or generating more than $75 in monthly dispute volume).
Mastercard enforces a parallel system governed by its global Mastercard Customer Compliance Programmes, which include:
- Excessive Chargeback Program (ECP);
- Excessive Fraud Merchant (EFM) systems.
These networks monitor standard violations at a 1% chargeback ratio and escalate to intensive monitoring and critical enforcement actions at 1.5%.
Card network compliance hinges entirely on proving active, continuous oversight rather than executing delayed terminations without intermediate logs. To prevent systemic compliance failures, a scale-ready monitoring architecture must maintain automated, time-stamped records detailing exactly when risk trends were detected, how processing limits were adjusted, and the precise trail of analyst reviews.
MATCH List Obligations at Portfolio Scale
When a payment provider terminates a merchant relationship for cause, it faces a mandatory requirement to report the entity to Mastercard’s Member Alert to Control High-Risk Merchants (MATCH) system.
The criteria for a MATCH listing are:
- confirmed fraud;
- laundering patterns;
- sustained excessive chargebacks;
- data compromises;
- severe card network rule violations.
Managing MATCH submissions manually across dozens of monthly terminations introduces critical compliance risks, from missed filings to misclassified reason codes. To eliminate these exposures, the monitoring engine must automatically evaluate for-cause terminations against network criteria and auto-assemble the merchant’s corporate records into a formatted compliance package for immediate submission.
Suspicious Activity Reporting and the Merchant Risk Audit Trail
Under the Bank Secrecy Act (BSA) and global Anti-Money Laundering (AML) regulations, payment facilitators and financial institutions must file Suspicious Activity Reports (SARs) within 30 days of detecting a potentially illicit pattern. This obligation applies with particular weight to platforms operating in payment facilitation, given the volume of merchant accounts they oversee. Regulatory bodies look closely at two core capabilities:
- the platform’s systematic ability to detect suspicious activity;
- the accuracy of its investigative records.
According to a 2025 Deloitte Compliance Infrastructure Report, financial institutions utilizing rule-based legacy infrastructure experienced an average 35% delay in identifying complex, multi-layered transaction risks compared to organizations with automated data pipelines. This delay can lead to late SAR filings, exposing platforms to regulatory penalties.
A production-grade merchant monitoring framework serves as a platform’s primary defense during regulatory audits. The architecture must automatically maintain an unalterable, time-stamped record of all incoming signals, generated risk scores, analyst notes, and mitigation steps. When an investigator must file a SAR, they should not have to manually gather fragmented transaction logs or cross-reference separate web monitoring tools. The monitoring architecture should generate a comprehensive audit trail automatically, preserving the necessary evidence trail.
Building vs Buying Merchant Risk Monitoring at Scale
Once the architecture gap is understood, the decision space has three options: adopt a commercial merchant risk platform, build a custom monitoring layer, or run a hybrid. This table can help you choose.
Consideration | Commercial Platform (Sardine, Fraud.net, etc.) | Custom Build | Hybrid |
|---|---|---|---|
Cross-network merchant intelligence | Strong: signals from multiple acquirer and platform networks | Absent: limited to your own portfolio history | Partial: third-party enrichment for external signals; custom scoring for portfolio-specific signals |
Portfolio-specific risk model accuracy | Generic: trained on aggregated merchant data across industries | High: trained on your portfolio’s specific merchant mix, MCC distribution, and historical risk patterns | High: custom model with third-party signal enrichment |
Compliance documentation generation | Varies: some platforms provide audit trails; confirm MATCH and SAR documentation coverage before selection | Full control: documentation generated exactly as regulatory and legal requirements demand | Custom documentation layer with third-party signal provenance |
Response tier automation | Varies by platform: typically configurable rules-based tiers; ML scoring quality varies | Full control: ML-scored tiers calibrated to your portfolio and regulatory context | Custom tier logic with third-party risk scores as inputs |
Time to production | Weeks to months (integration and configuration) | 6–12 months for production-grade system with ML pipeline | 3–6 months (custom layer over integrated third-party platform) |
Ongoing maintenance | Vendor-managed model updates; configuration changes require vendor support | Internal ownership: retraining, threshold management, new signal integration | Split: vendor manages external signals; internal team manages scoring and response logic |
Cost at scale | Per-merchant or per-transaction pricing that scales linearly with portfolio growth | Fixed engineering cost; infrastructure cost scales sub-linearly with portfolio growth | Reduced commercial platform fees (fewer signals needed) + internal engineering cost |
Consideration
Cross-network merchant intelligence
Portfolio-specific risk model accuracy
Compliance documentation generation
Response tier automation
Time to production
Ongoing maintenance
Cost at scale
Commercial Platform (Sardine, Fraud.net, etc.)
Strong: signals from multiple acquirer and platform networks
Generic: trained on aggregated merchant data across industries
Varies: some platforms provide audit trails; confirm MATCH and SAR documentation coverage before selection
Varies by platform: typically configurable rules-based tiers; ML scoring quality varies
Weeks to months (integration and configuration)
Vendor-managed model updates; configuration changes require vendor support
Per-merchant or per-transaction pricing that scales linearly with portfolio growth
Custom Build
Absent: limited to your own portfolio history
High: trained on your portfolio’s specific merchant mix, MCC distribution, and historical risk patterns
Full control: documentation generated exactly as regulatory and legal requirements demand
Full control: ML-scored tiers calibrated to your portfolio and regulatory context
6–12 months for production-grade system with ML pipeline
Internal ownership: retraining, threshold management, new signal integration
Fixed engineering cost; infrastructure cost scales sub-linearly with portfolio growth
Hybrid
Partial: third-party enrichment for external signals; custom scoring for portfolio-specific signals
High: custom model with third-party signal enrichment
Custom documentation layer with third-party signal provenance
Custom tier logic with third-party risk scores as inputs
3–6 months (custom layer over integrated third-party platform)
Split: vendor manages external signals; internal team manages scoring and response logic
Reduced commercial platform fees (fewer signals needed) + internal engineering cost
Businesses evaluating this choice should cross-reference the considerations mapped out in our article on choosing an in-house fraud system vs SaaS fraud tools.
Key Takeaways
- Stretching a legacy risk monitoring system to 4,000-5,000 merchants reduces manual oversight efficiency but generates 200-500 weekly alerts that cause severe analyst fatigue.
- Relying on manual compliance documentation during merchant portfolio expansion creates compliance gaps that result in regulatory penalties and late Suspicious Activity Report filings.
- Transitioning to automated machine learning triage filters out roughly 50% of total daily alert volume by automatically handling low-severity events, freeing analysts for high-stakes investigations.
- Using rigid rules-based engines rather than rolling behavioral baselines overlooks merchant transaction velocity spikes and leads to late fraud detection.
- Failing to automate Visa VAMP or Mastercard compliance workflows under large portfolio volumes delays mandatory MATCH submissions and increases card network penalties.
In short: Scaling merchant risk monitoring requires transitioning from manual, rules-based triage to automated, machine-learning-driven architectures to prevent alert fatigue and compliance failures.
FAQ
What is merchant risk monitoring?
Merchant risk monitoring is the systematic oversight of businesses using a payment platform to detect fraudulent behavior, transaction anomalies, and compliance violations. It operates as a continuous lifecycle management process. The system tracks dynamic metrics like chargeback ratios, refund rates, and corporate registration updates to protect payment processors, PayFacs, and marketplaces from financial losses and regulatory penalties.
What is Visa VAMP and how does it affect merchant monitoring requirements?
The Visa Acquirer Monitoring Program (VAMP) is a strict compliance framework that places payment institutions under intense observation if their portfolio fraud or dispute rates cross specific limits. It affects monitoring requirements by enforcing two hard, quantitative metrics:
- High Fraud Merchant (HFM): Triggered when fraud basis points exceed 5 BPS on Visa transaction volume.
- High Chargeback Merchant (HCM): Triggered when an account exceeds a 0.9% chargeback-to-transaction ratio or generates more than $75 in monthly dispute volume.
What is the difference between transaction monitoring and merchant monitoring?
While transaction monitoring evaluates individual payment events in real time to stop immediate fraud, merchant monitoring focuses on the holistic, long-term behavior of the business account itself. Merchant monitoring tracks systemic shifts over 7 to 90-day windows, such as a merchant’s overall chargeback velocity accelerating toward card network thresholds, sudden bank account changes, or corporate ownership modifications.
At what portfolio size does merchant risk monitoring need to become automated?
A manual monitoring approach typically functions well at a small scale of around 100 to 200 merchants, where teams handle only 10-20 alerts per week. However, the architecture collapses and must become automated when scaling to 4,000 to 5,000 merchants. At this volume, legacy systems flood teams with 200-500 alerts a week, drowning analysts in backlogs and forcing platforms to automate their workflows to survive.
What signals should a merchant risk monitoring system collect?
A scale-ready architecture must ingest continuous, multi-source data streams across three primary categories:
- Transactional Signals: Real-time chargeback ratios, refund rates exceeding twice the baseline, spikes in transaction velocity, and ticket size deviations.
- Behavioral Signals: Shifts in geographic processing locations, changes in payment method mix, and uncharacteristic time-of-day processing concentrations.
- External & Account Signals: Continuous web crawls for adverse media/regulatory actions, daily sanctions list checks, login anomalies, and changes to bank routing numbers or ultimate beneficial owners.
What is alert fatigue in merchant risk monitoring and how is it addressed?
Alert fatigue occurs when a rules-based system floods a small team of analysts with hundreds of sub-threshold or repetitive alerts, making it impossible to review them all in time.
Scaled systems address alert fatigue by replacing flat, chronological queues with ML-Scored Alert Prioritization and Tiered Response Automation. Machine learning models rank threats based on compounding risks, automatically logging or batching low-risk events. This structural shift removes roughly half of the daily alert volume from the queue, allowing human analysts to focus exclusively on high-stakes investigations.