

Retail generates raw data nonstop: sales, inventory, customer interactions, foot traffic, service requests, and feedback, scattered across systems with different formats and refresh cycles. Gartner notes that in 2025, about 75% of data is generated outside centralized data centers or cloud regions, which makes governance and unification across stores, devices, and the edge harder.
When information sits in silos, traditional reporting starts to lag behind reality and prevents the right decisions from being made. And when the underlying data is messy, the cost skyrockets: Gartner estimates poor data quality costs organizations $12.9M per year on average.
However, retail business intelligence connects business data to what’s actually happening in stores and across channels, which helps teams tie insights to trackable business outcomes. This article explains the nuanced aspects of retail analytics business intelligence and how to implement it well.
Key Takeaways:
- Successful retail BI relies more on integrated data models, clear KPI definitions, and strong data quality management than on the tools themselves.
- Retail BI brings together fast-changing data from POS, eCommerce, inventory, CRM and loyalty programs, marketing, foot traffic, and service into a single, consistent view.
- If data is kept in separate systems or is low quality, reporting can lag behind what’s really happening and become expensive and unreliable for making decisions.
- Reporting tells you what happened, BI tells you what’s going on and what’s driving it, and analytics estimates what’s likely next.
- BI is most useful when it helps people decide what to do next with alerts, drill-downs, and clear next steps tied to owners and workflows.
What Is Business Intelligence in Retail?
Business intelligence in the retail industry turns data (sales, inventory, pricing, promotions, customer activity, and store operations) into straightforward metrics, dashboards, and recommendations that teams can actually use to make decisions. And the impact of big data is that retail signals now come in at high volume, high velocity, and from dozens of sources at once, which raises the bar for how quickly and reliably teams need answers.
Retail business intelligence evolved from traditional reporting and decision-support systems, and today it often overlaps with analytics. For this reason, terms like basic reporting and business analytics are often used interchangeably with BI. However, on closer look, they’re different practices that solve different problems.
- Basic reporting tells businesses what already happened. It’s about static and often spreadsheet-driven reports that recap past performance.
- Business intelligence moves organizations from recap to visibility. It answers what’s happening now, why it’s happening, and where to dig deeper thanks to standardized KPIs, governed definitions, interactive dashboards, drill-downs, and alerts that surface issues.
- Business analytics looks forward and focuses on what’s likely to happen next and what to do about it through data analytics, namely forecasting, segmentation, optimization, experimentation, and prescriptive recommendations.
In practice, strong retail organizations combine BI and analytics. Retail business intelligence provides the single truth of performance, while analytics pushes into prediction and optimization.
Retail intelligence is especially challenging because what’s true can change by the hour and differ across channels. MIT Sloan notes that physical retail still accounts for the majority of sales in 2025, which means retail insight can’t live solely in eCommerce dashboards.
Retail also runs on tight economics. Deloitte’s analysis of the Top 250 global retailers shows an average net profit margin of 4.3%, so small improvements in pricing, availability, and waste can materially shift performance. Harvard Business Review Analytic Services also found 82% of retailers prioritized improving customer experience, which includes raising the bar for personalization, consistency, and service across customer channels. McKinsey reports support that priorities by saying that effective personalization often drives 10–15% revenue lift.
To make such improvements possible, retail BI solutions typically follow a three-step shift. First, they bring scattered raw data from POS, eCommerce, inventory, CRM, customer loyalty programs, marketing, and foot traffic into a structured model. Then, they use historical performance to generate predictive insights like demand, replenishment, staffing needs, promo impact, and risk signals (stockouts, overstocks, churn). After, they upgrade dashboards from simple charts to clear next steps.
Once these steps are in place and integrated into retail business intelligence software, different teams and employees can use them as they see fit. Common patterns include:
- Leaders track sales, gross margin, promo ROI, inventory turn, and availability.
- Merchandising teams monitor product performance, basket patterns, price/margin waterfalls, and assortment gaps.
- Ops teams watch low-stock risk, overstocks, DC-to-store flow, shrink signals, and on-shelf availability.
- CRM and marketing teams follow cohort retention, CLV proxies, campaign response, and segment customer behavior.
- Store teams compare footfall to transactions, spot productivity shifts, map peak-hour patterns, and uncover service bottlenecks.
Sergii Leleko
ML & AI Engineer at SPD Technology
‘‘‘Many retailers combine retail business intelligence solutions with data warehouse or lakehouse setups and retail-specific data tools. This creates shared definitions, connected data, and insightful decisions.’’
Key Data Sources Powering Retail Business Intelligence
Retail business intelligence solutions only become reliable when they draw from the right data sources and treat them as one connected system. Core data sources in retail BI include:
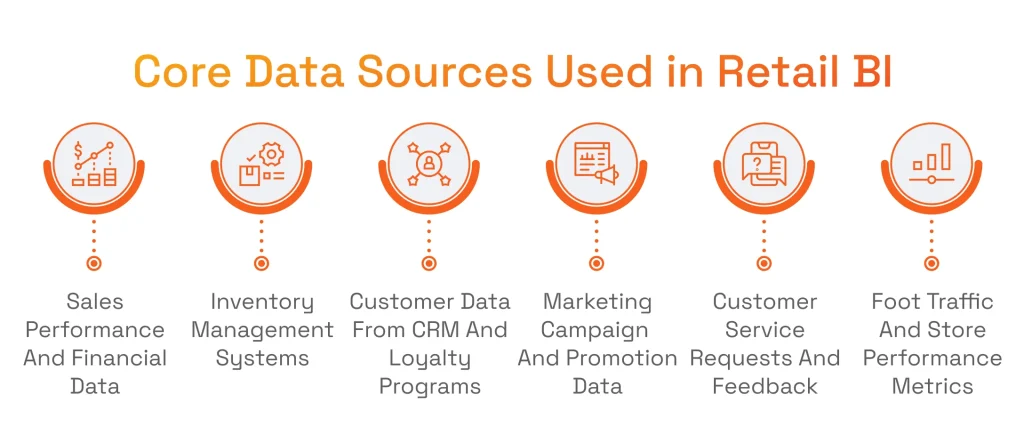
- Sales data & sales performance: POS transactions, eCommerce orders, returns, discounts, promotions, and channel performance;
- Inventory data & inventory management systems: stock on hand, stock in transit, replenishment, purchase orders, DC/store movements, shrink;
- Customer data from CRM and loyalty programs: profiles, loyalty activity, segments, repeat purchase behavior, lifetime value proxies;
- Marketing campaigns & targeted marketing campaigns: spend, impressions/clicks, attribution inputs, promo calendars, offer performance;
- Customer service requests and customer feedback: tickets, reasons for contact/returns, sentiment signals, survey results, reviews;
- Reliable foot traffic data & store performance metrics: visits, dwell time, conversion proxies, staffing coverage, queue/service indicators;
- Financial data (profitability, costs, cash flow): margin, COGS, markdowns, operational costs, logistics costs, cash flow metrics.
With so many data sources, retailers run into scale issues fast. This is where the importance of data integration becomes evident for implementing BI solutions. Integration aligns entities (products, stores, customers), standardizes metric definitions, and creates a consistent view across channels.
However, for a smooth integration, data quality must be given special attention. Data quality management, with its validation rules, anomaly detection, lineage, and ownership, keeps KPIs stable and comparable over time. At the core, integrated data plus disciplined data quality make retail BI trustworthy.
Key Benefits of Business Intelligence in Retail
Retail BI pays off the retail industry in three ways: it tightens operations, sharpens demand visibility, and strengthens market position.
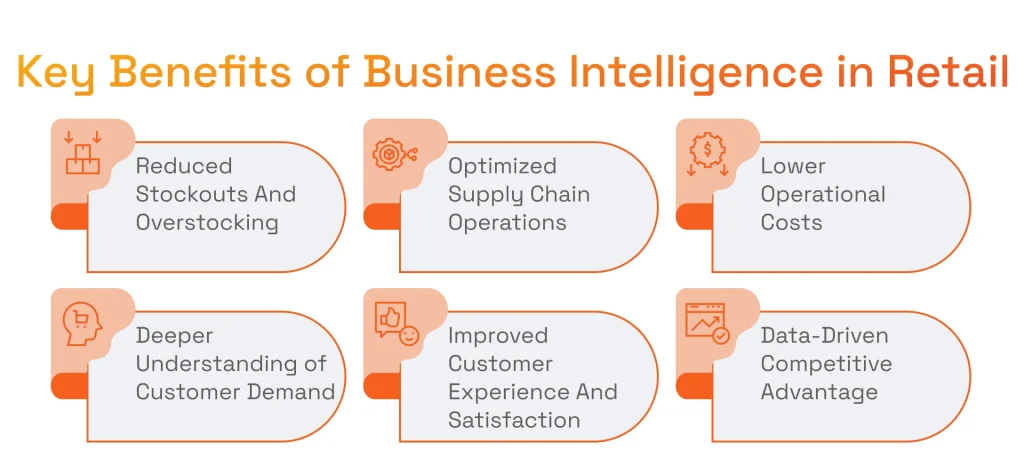
The first is reflected in operational efficiency and cost control. BI retail management exposes where value leaks in everyday execution: stockouts that turn into missed sales, overstocks that turn into markdowns, and delays that spread across the network. This supports supply chain optimization and helps teams rebalance inventory faster.
The second is driven by demand and customer intelligence. BI connects what customers do with what the business does, so preferences and changes in customer demand become visible early. This helps retailers tailor assortments, pricing, and promotions to real behavior, improving the customer experience and raising customer satisfaction through more consistent availability and more relevant engagement.
The last is achieved thanks to BI’s ability to create a performance advantage through speed. Retailers that operate with data-driven insights move faster on trends, correct course sooner, and execute with fewer blind spots. Over time, that consistency builds into a reliable way to stay ahead in a market that’s always changing.
Sergii Leleko
ML & AI Engineer at SPD Technology
“Retail is always in motion, and business intelligence helps retailers keep pace with that change. Using data to guide everyday decisions makes it easier to steer the business steadily.”
Retail Business Intelligence Use Cases Across the Retail Industry
With the aforementioned benefits, many retail functions look at retail BI as a decision engine. The highest-impact use cases tend to cluster around the moments where speed and accuracy matter most. Below are the most common BI applications across the retail industry.
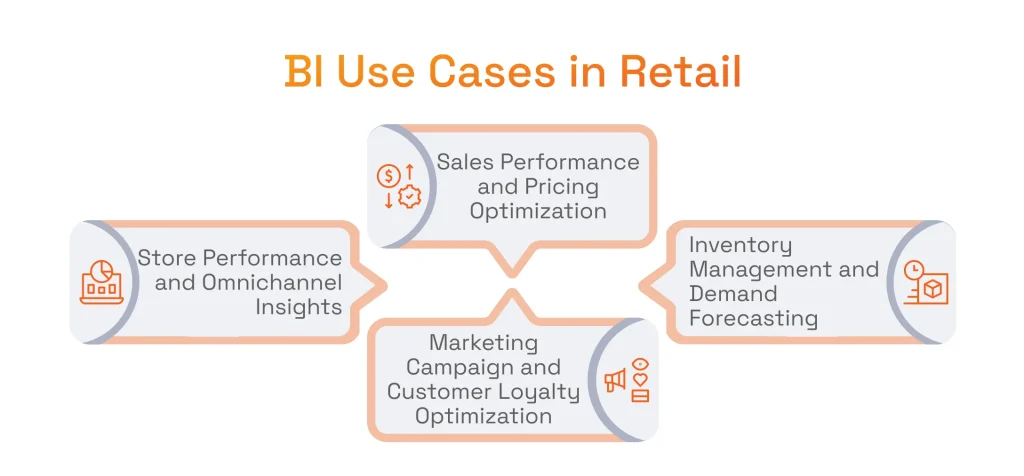
Sales Performance and Pricing Optimization
Retail BI turns sales reporting into a decision tool. Instead of looking at totals after the fact, teams track and analyze sales patterns and market trends as they unfold (by channel, region, store format, and product group) so they can separate a real shift in demand from a short-lived spike.
From there, BI supports tighter pricing strategies: it shows where price changes lift volume, where discounts dilute margin, and which offers shift the mix in the wrong direction. It also makes profitability visible by clearly distinguishing high-margin from low-margin products, which helps retailers protect margin while staying competitive. Where BI goes further, artificial intelligence for customer behavior analysis helps identify early behavioral shifts that affect pricing response and intent.
Inventory Management and Demand Forecasting
Stock decisions don’t happen once a quarter, they happen every day, across every location. To balance inventory levels across stores and DCs, retailers use BI that helps bring sales velocity, on-hand stock, inbound supply, and lead times into one view. This way, replenishment reflects what consumer demand looks like now.
BI can also leverage demand forecasting in retail with machine learning to extend its capabilities further. Specifically, it can use historical data performance to forecast what demand will look like next, accounting for seasonality, promotions, regional differences, and product lifecycles. That combination reduces stockouts, supports accuracy in supply and does not invite markdown-heavy overstocks.
Marketing Campaign and Customer Loyalty Optimization
Business intelligence tracks marketing performance across the entire journey. It helps fine-tune campaigns by showing which customer segments actually convert, which channels keep shoppers coming back, and which offers only deliver a short-lived boost. On top of that, business intelligence solutions make loyalty programs stronger by tracking how different customer groups behave over time: who stays engaged, who drifts away, and what truly moves the needle.
With the help of natural language processing (NLP) in business intelligence, marketing teams can turn messy text feedback into metrics that are measurable and comparable. NLP can group reviews, surveys, chats, and service notes into clear themes, track sentiment shifts by product, store, or channel, and flag emerging issues early. In this manner, teams can tie feedback back to campaigns and customer journeys.
Store Performance and Omnichannel Insights
Business intelligence tools help channels consistently measure progress to ensure accurate omnichannel performance. With shared KPIs, businesses can compare stores and regions and see what’s really driving conversion, productivity, and on-shelf availability. It also connects the dots between in-store and online behavior, so retailers understand the full shopping path.
Most importantly, BI retail management connects customer interactions end to end, eliminating any blind spots caused by separate systems. Artificial intelligence for the retail industry strengthens this layer with faster anomaly detection and automated insights, so teams spot issues early and respond before they turn into lost sales or poor experiences.
Real-World Examples and Case Studies in Retail BI
Real-world success stories from top retailers reveal the significant influence of business intelligence on the retail sector.
One prominent example is Walmart. The major retailer describes Wally as a data analytics and visualization platform for merchandising teams that aggregates sales, inventory, and demand signals and helps leaders spot when products run low and coordinate actions to keep shelves stocked across stores and online. In this process, business intelligence software consolidates operational data into a shared view and supports decisions that optimize inventory management and availability.
Another retailer that uses retail business intelligence tools at scale is Target. Target leaders describe how the company applies data science to improve on-shelf availability, reduce inventory levels, and drive operating efficiencies, work that includes improving demand-forecasting models and using algorithms to increase supply-chain fulfillment speed. Used alongside data science, BI provides the integrated data and consistent KPIs (in-stock/OSA, inventory levels, fulfillment performance) that teams use to monitor these initiatives, track results over time, and turn model outputs into day-to-day decisions.
A third example of the use of BI tools comes from Sephora. In a case study, Sephora describes a reporting stack where marketing data is consolidated and cleaned, sent to BigQuery, transformed with dbt, and visualized in Looker Studio. BI works here as the standardized reporting layer. It provides clean, modeled tables and dashboards that speed up cross-channel measurement and reduce manual reporting effort.
Key Performance Indicators Retail BI Helps Track
Since retail is a fast-paced niche, key performance indicators give teams a view of true business performance: what’s slipping, where to focus, and whether improvements deliver real results. Business intelligence tools strengthen this process by making KPIs accurate, consistent, and actionable. The table below outlines the key retail metrics that BI helps monitor and improve.
| KPI CATEGORY | KEY METRICS TRACKED WITH BI | WHAT THESE KPIS REVEAL | STRATEGIC BUSINESS VALUE |
|---|---|---|---|
| SALES PERFORMANCE KPIS | Sales performance, sales trends, average transaction value | How revenue is evolving across products, channels, and time periods | Enables revenue growth optimization, pricing strategy refinement, and demand forecasting |
| CUSTOMER KPIS | Customer engagement, customer retention rates, customer satisfaction scores | How customers interact with the brand and what drives loyalty or churn | Improves customer lifetime value, loyalty program effectiveness, and personalized marketing |
| INVENTORY & OPERATIONS KPIS | Inventory turnover, stock availability, operational costs | How efficiently inventory and operations support demand | Reduces stockouts and overstocking, lowers costs, and improves operational resilience |
Business Intelligence in Retail Trends Shaping the Future
Retail BI is shifting from better dashboards to a decision system that anticipates what comes next and guides action in real time. As data volumes grow and customer behavior fragments across channels, retailers increasingly treat data analytics as a core operating capability.
- Rise of predictive analytics and AI-driven BI tools. BI platforms use predictive analytics to accelerate analysis, automate data preparation, and surface subtle patterns. Replacing manual work, predictive analytics also flags stockouts, demand spikes, and margin erosion, and prioritizes issues to solve.
- From descriptive to prescriptive analytics. In retail, the combination of descriptive business intelligence solutions and prescriptive analytics serves as guidance on pricing moves, replenishment actions, promo adjustments, and assortment changes, grounded in margin, availability, and service levels.
- Customized retail BI for specific business models. Grocery, fashion, marketplaces, and omnichannel chains run on different rhythms, constraints, and KPIs. This is why BI tools and semantic layers are designed around the business model for analytics to reflect how the retailer actually operates and how decisions are made.
- Democratization of BI for business users. One of the key benefits of business intelligence nowadays is that it helps non-technical users explore data directly through governed metrics, guided experiences, and natural-language querying. This is possible because of standardized definitions and role-based access.
- Real-time analytics and automated insights. Modern BI increasingly relies on streaming or near-real-time signals, paired with automated alerting, so teams respond to exceptions as they emerge rather than after weekly reports.
- A growing role of data analytics in strategic planning. Retailers use data analytics services to shape strategy and pay attention to network expansion, channel investments, pricing posture, loyalty economics, and supply chain design.
Learn more about the role of data analytics in retail in our featured article!
Retail Business Intelligence Implementation: Where Most Retailers Struggle
Retail business intelligence implementation has its challenges. Data is fragmented across POS, eCommerce, inventory, marketing, and customer systems, and doesn’t reconcile. Even when the pipes connect these systems, poor data quality can be an issue due to inconsistent product hierarchies, duplicate customer records, missing returns logic, lagging inventory updates, and mismatched store IDs. And when teams move fast without a shared plan, a lack of alignment between business users and technical teams turns BI into reports with business performance metrics and actionable insights the business didn’t ask for or requirements that don’t reflect how stores actually operate.
BI only works when it mirrors retail business operations. This is why the hard part in implementing BI is defining the metrics, workflows, and decision points those dashboards must support. To navigate this complexity, retail businesses should consider external expertise.
How to Start Leveraging Business Intelligence in Retail: The Right Way
Intelligence in the retail industry works best when it’s treated as a mindset shift. First, companies move from basic reporting to valuable insights. It is done by standardizing KPIs and consolidating customer and sales data from all channels. Next, retailers move from insights to action. It is handled by tying BI outputs to clear owners, workflows, and alert thresholds.
To perform this shift, retailers need a durable foundation for business intelligence tools. It must be built on modern data platforms and reliable pipelines. This is where the benefits of cloud computing infrastructure are needed: elastic compute for seasonal peaks, faster provisioning for new data sources, centralized governance, and more dependable refresh cycles for near-real-time reporting.
Sure thing, the overarching goal of any BI initiative is to bring long-term outcomes. That means starting with the decisions that move the business (availability, pricing, assortment, fulfillment, retention) and measuring impact through margin, cash, service levels, and customer experience. In mature programs, AI, specifically generative AI development, strengthens this alignment by reducing friction between questions and answers.
We believe that only partners with exceptional technical expertise and the knowledge of market nuances can approach BI implementation in the retail sector with confidence. Here, at SPD Technology, we help retailers move from ambition to execution with less risk and more adoption. Acting as you an end-to-end delivery partner, our teams support the data foundation, BI design, and analytics enablement needed to turn retail data into repeatable decisions, which captures the advantages of strategic technology consulting through a structured approach with the design of BI architectures for scalability, integrate complex data sources for a unified view, and built analytics systems focused on decision-making with actionable KPIs for clarity.
Looking for a trusted partner for BI implementation?
Find them in our article dedicated to prominent business intelligence consulting companies!
Conclusion: Retail BI as a Foundation for Sustainable Growth
Omnichannel complexity, tight margins, and fast-moving demand make reporting in the retail industry too slow and too risky. This is why retail BI solutions are crucial tools nowadays. They help with sales performance, inventory management, marketing, and store performance, and ultimately gaining a competitive advantage.
Retail business intelligence solutions consolidate the data from multiple retail sources, analyze it, and provide dashboards, metrics, and reports that allow businesses to make crucial decisions with ease and precision. If you plan implementing customized retail BI tools, reach out to our team, and we will gladly help.
FAQ
What Is Retail Business Intelligence?
Retail business intelligence is how retailers pull sales, inventory, pricing, and customer data into consistent metrics and dashboards, so teams can spot issues early and act fast.
What Are the 4 Pillars of Business Intelligence?
Retail business intelligence stands on four pillars:
- Data foundation: reliable sources, clean definitions
- Integration: connect systems into one view
- Analysis: KPIs, market trends, drill-downs, alerts
- Action: embed valuable insights into workflows and ownership