

Financial business intelligence (FBI) transforms raw financial data into real-time insights through data integration, predictive analytics, and interactive dashboards. It powers budgeting and forecasting, expense management, KPI monitoring, fraud detection, and strategic decision support, replacing static reports with live views of financial performance. With the global BI market projected to reach $63.17 billion by 2034 and 77% of CFOs increasing tech spending, BI has become core infrastructure for finance teams.
As digital transactions, customer interactions, and market dynamics generate massive amounts of data daily, financial businesses try to leverage that data and create actionable insights for better decisions. Business intelligence (BI) plays a central role here since it enables companies to systematically collect, integrate, analyze, and present this vast and diverse data in meaningful ways. This is why the global BI market, growing at a CAGR of 7.26%, is projected to reach $63.17 billion by 2034.
Financial business intelligence (FBI) elevates financial management by offering enhanced strategic decision-making through real-time data analytics, improved forecasting with predictive analytics, strategic planning thanks to scenario modeling, and more. This article delves into its role, potential, complexities and proven ways to effectively implement financial BI for your organization.
The Growing Role of Business Intelligence in the Financial Industry
Financial business intelligence is the set of tools and practices that collect data from accounting software, ERPs, CRMs, and transaction systems and turn it into dashboards, reports, and forecasts. CFOs, finance managers, risk teams, and executives at banks, insurers, asset managers, and fintech companies use it to track performance, plan budgets, and detect risk, which is why the role of business intelligence in the financial industry keeps expanding.
With 77% of CFOs having committed to boosting technology spending and 76% taking direct ownership of enterprise data and analytics strategy, it’s no surprise that metrics, analytics, and reporting have become their top priority.
Since the business impact of Big Data is evident in every operation in the financial industry, BI enables unlocking the full potential of that data via reports and dashboards. Reporting capabilities allow for the creation and distribution of standardized or customized reports. Meanwhile, data visualization techniques (graphs, charts, and heat maps) provide an interactive way to explore financial data. Consequently, operation teams receive the possibility of spotting trends or anomalies and interpret them to reveal the root causes of performance fluctuations, highlight potential cost-saving opportunities, and guide resource allocation. What’s more, BI introduces automation, which eliminates time-consuming manual input and reduces errors, thereby allowing professionals to focus on creative and high-value tasks.
BI’s impact goes beyond operations and supports strategic endeavors. Finance BI empowers CFOs to shape long-term organizational direction. BI tools help CFOs utilize sophisticated analytics and predictive modeling to simulate financial scenarios and make decisions that protect and improve future financial performance. These insights support more precise forecasting and provide finance leaders with the possibilities to fine-tune budgets, optimize investments, and mitigate potential risks before they impact the company.
Advantages of Finance Business Intelligence
The financial organizations become more data-driven and create more value thanks to the beneficial impact of BI capabilities, such as:
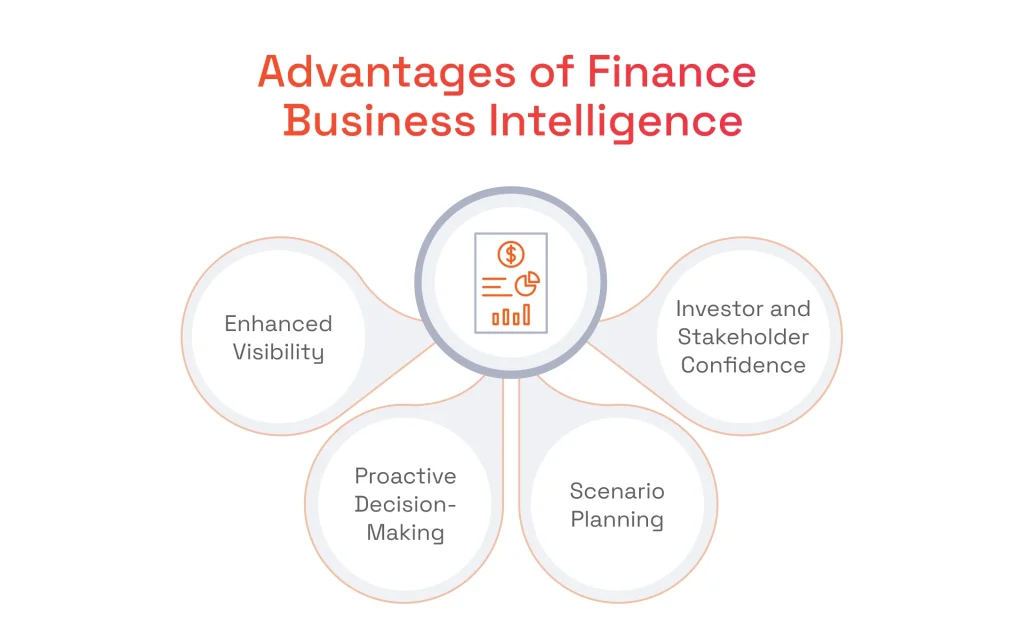
- Enhanced Visibility: FBI eliminates data silos and creates a single source of truth to ensure that CFOs, finance managers, and other stakeholders can get immediate access to up-to-date information once they need it. This makes it easier to identify trends, spot potential issues early, and align financial strategies across the organization.
- Proactive Decision-Making: Real-time dashboards in FBI enable finance teams to respond quickly to changing market conditions or internal performance shifts. Instead of waiting on batch financial reports or manual updates, employees who make decisions receive automatic alerts and live KPIs to be able to act on insights as soon as they arise.
- Scenario Planning: Financial BI tools provide “what-if” modeling capabilities to allow finance leaders to simulate potential outcomes of different potential strategies. In this manner, financial leaders can have scenarios of the impact of changes in pricing, market demand, or operational costs.
- Investor and Stakeholder Confidence: FBI systems provide the ability to present data-driven reports by drawing on real-time financial data and advanced analytics. This helps deliver precise, transparent information about financial health for external parties.

Serhii Leleko
AI & ML Engineer at SPD Technology
“Today, it is impossible to imagine a financial company without BI tools integrated into their everyday processes. As regulations change, the market fluctuates, and customers perform endless transactions, only BI can help unify this endless flood of information and make effective use of it.”
Applications of Business Intelligence in Financial Services
In financial services, business intelligence covers a range of critical activities thanks to its abilities to process vast amounts of data, identify trends, and deliver deeper insights in real-time. Below are some of the key areas where BI plays a pivotal role.
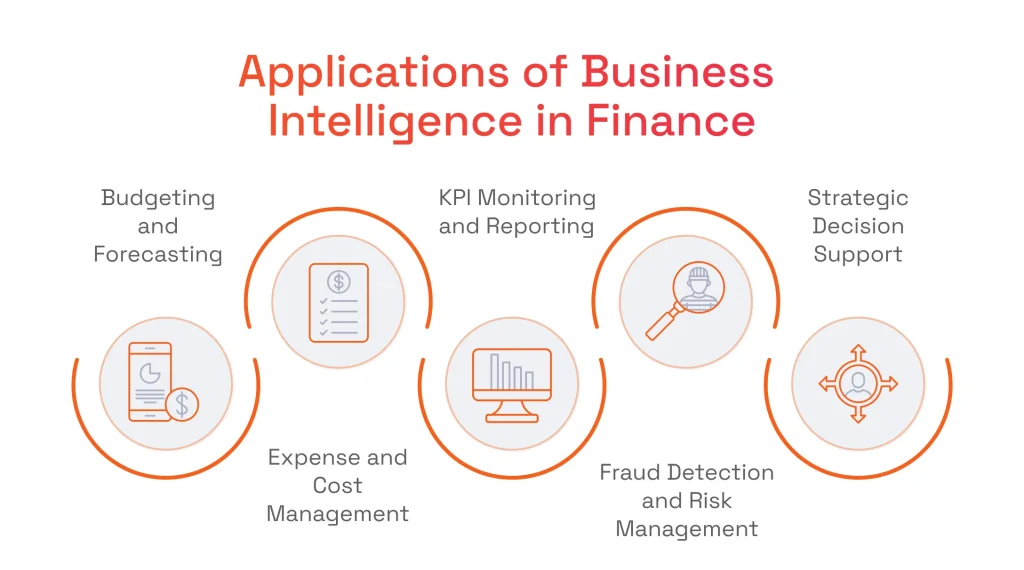
Budgeting and Forecasting
BI introduces advanced analytics features, including predictive modeling and scenario analysis to refine financial estimates. This allows finance professionals to see past expenses, revenue streams, cash flows, and profit margins as well as changes in consumer behavior, technological advancements, regulatory shifts, and live updates on cash balances, transaction volumes, account receivables and payables.
By doing so, they get a holistic perspective of financial information to come up with prognosis on the future budgets without the need for manually juggling multiple spreadsheets and disparate data sources. Additionally, visualizing financial data makes it much easier for stakeholders to interpret complex forecasting models.
Expense and Cost Management
To scrutinize countless transactions for understanding where and how financial resources are being used, BI tools enable intelligent automation that covers the aggregation of expense data across several sources. With it, finance managers can analyze data on spending trends, pinpoint cost drivers, and identify inefficiencies almost in real time. In such a way, they achieve visibility of spendings and can get control over expenses to make sure that the organization maintains optimal profit margins.
KPI Monitoring and Reporting
Business intelligence is usually backed up by advanced data analytics in finance that allows assessing an organization’s financial health by tracking KPIs (revenue growth, profit margins, liquidity ratios, etc.) and consolidating this data into concise reports or even dashboards. This leads to a centralized view that provides stakeholders with an accurate big picture of organizational performance. This reporting can be further set up to be done automatically for timely insights and quick addressing of performance issues, gaps, or inconsistencies. Thus, financial organizations ensure continuous improvement and a data-driven approach to business growth.
Fraud Detection and Risk Management
To prevent fraud and manage risks, it is essential to analyze massive volumes of transactional data, preferably in real time. With business intelligence, finance organizations apply BI tools for credit card fraud detection, identity theft prevention, money laundering control, and more. It can be done since BI-driven tools are powered by advanced analytics and ML to recognize specific patterns (unusual transaction frequency, sudden changes in account behavior, user anomalies, etc.) and act to mitigate them. What’s more, BI-driven scenario analysis allows risk management teams to try out several scenarios for stress factors and understand how to approach the most vulnerable aspects of their systems.
Strategic Decision Support
BI tools help to make the most out of market trends, competitive positioning, and internal operational efficiencies. The primary benefit here comes from the fusion of advanced analytics and scenario simulation. The first gives executives the power to evaluate potential acquisitions, new product lines, or geographic expansions, collect key indicators (market share, customer segments, profitability metrics, etc.), and map strategic initiatives based on them. The second allows testing the potential performance of these initiatives under various conditions to enable executives to anticipate possible outcomes.
What Each Financial BI Application Needs from Your Data
Each application of business intelligence in financial services places different demands on the data model and on how fresh the data must be. These demands decide the order in which a finance team can realistically roll out BI capabilities.
Application | Data it relies on | Required freshness | Implementation note |
|---|---|---|---|
KPI monitoring and reporting | Consolidated general ledger, revenue, and cost data | Daily or end of period | Usually the first phase: delivers early wins once data is consolidated |
Expense and cost management | Accounts payable, procurement, and expense data | Daily to near real time | Follows once cost centers and categories are standardized |
Budgeting and forecasting | Multi-year history plus business drivers (volumes, pricing, market data) | Weekly or monthly | Requires a clean historical dataset in a central warehouse |
Fraud detection and risk management | Transaction events, behavioral signals, customer profiles | Seconds or less | Needs streaming pipelines and ML models, often a separate track |
Strategic decision support | Internal financials plus market and competitor data | Monthly or quarterly | Builds on all the layers above |
Application
KPI monitoring and reporting
Expense and cost management
Budgeting and forecasting
Fraud detection and risk management
Strategic decision support
Data it relies on
Consolidated general ledger, revenue, and cost data
Accounts payable, procurement, and expense data
Multi-year history plus business drivers (volumes, pricing, market data)
Transaction events, behavioral signals, customer profiles
Internal financials plus market and competitor data
Required freshness
Daily or end of period
Daily to near real time
Weekly or monthly
Seconds or less
Monthly or quarterly
Implementation note
Usually the first phase: delivers early wins once data is consolidated
Follows once cost centers and categories are standardized
Requires a clean historical dataset in a central warehouse
Needs streaming pipelines and ML models, often a separate track
Builds on all the layers above
This is why finance teams often start with reporting and expand toward forecasting and real-time risk analytics as their data foundation matures.
Financial Business Intelligence Software and Tools
Choosing financial business intelligence software starts with the role each tool plays in your stack. A typical finance BI setup combines a data layer that collects and stores data, an analytics layer that models it, and a presentation layer where finance teams work with dashboards and reports. The table below groups the main categories of financial BI tools by role.
Category | What it does | Typical examples | Best fit |
|---|---|---|---|
Data integration (ETL/ELT) | Extracts data from ERPs, accounting software, core banking, and payment systems, then transforms and loads it | Fivetran, Airbyte, dbt, Azure Data Factory | Companies consolidating many data sources |
Cloud data warehouses and lakehouses | Central storage that acts as a single source of truth | Snowflake, Google BigQuery, Databricks, Amazon Redshift | Growing data volumes and long history for forecasting |
Self-service BI and visualization | Interactive dashboards, reports, and ad hoc analysis | Microsoft Power BI, Tableau, Looker, Qlik | Finance teams that need flexible reporting |
FP&A and CPM platforms | Budgeting, planning, forecasting, scenario modeling, consolidation | Anaplan, Workday Adaptive Planning, Planful, Oracle EPM | Planning cycles and multi-entity consolidation |
Embedded ERP analytics | Built-in reporting inside finance systems | SAP Analytics Cloud, Oracle NetSuite analytics, Microsoft Dynamics 365 reporting | Companies standardized on one ERP |
Streaming and real-time analytics | Processes transaction events as they happen | Apache Kafka, Apache Flink, Amazon Kinesis | Fraud detection, transaction monitoring, live liquidity views |
Category
Data integration (ETL/ELT)
Cloud data warehouses and lakehouses
Self-service BI and visualization
FP&A and CPM platforms
Embedded ERP analytics
Streaming and real-time analytics
What it does
Extracts data from ERPs, accounting software, core banking, and payment systems, then transforms and loads it
Central storage that acts as a single source of truth
Interactive dashboards, reports, and ad hoc analysis
Budgeting, planning, forecasting, scenario modeling, consolidation
Built-in reporting inside finance systems
Processes transaction events as they happen
Typical examples
Fivetran, Airbyte, dbt, Azure Data Factory
Snowflake, Google BigQuery, Databricks, Amazon Redshift
Microsoft Power BI, Tableau, Looker, Qlik
Anaplan, Workday Adaptive Planning, Planful, Oracle EPM
SAP Analytics Cloud, Oracle NetSuite analytics, Microsoft Dynamics 365 reporting
Apache Kafka, Apache Flink, Amazon Kinesis
Best fit
Companies consolidating many data sources
Growing data volumes and long history for forecasting
Finance teams that need flexible reporting
Planning cycles and multi-entity consolidation
Companies standardized on one ERP
Fraud detection, transaction monitoring, live liquidity views
Build, Buy, or Configure?
Once the categories are clear, the next decision is how much of the stack to take off the shelf.
Approach | When it fits | Trade-off |
|---|---|---|
Buy | Standard reporting needs and processes that match the tool’s default data model | Fastest launch, limited flexibility |
Configure | Off-the-shelf platforms extended with custom data models, connectors, dashboards, and access rules | Balances speed and fit, requires integration expertise |
Build | Fintech and payment platforms that offer analytics to their own customers, or have latency, data residency, or regulatory needs standard tools cannot meet | Full control, higher upfront investment |
Approach
Buy
Configure
Build
When it fits
Standard reporting needs and processes that match the tool’s default data model
Off-the-shelf platforms extended with custom data models, connectors, dashboards, and access rules
Fintech and payment platforms that offer analytics to their own customers, or have latency, data residency, or regulatory needs standard tools cannot meet
Trade-off
Fastest launch, limited flexibility
Balances speed and fit, requires integration expertise
Full control, higher upfront investment
For custom and configured setups, SPD Technology’s financial analytics services cover the full path from data pipelines to finance-ready dashboards. Whichever approach you choose, evaluate financial business intelligence software against five criteria: integration with your existing systems, the data freshness your use cases require, compliance features such as audit trails and role-based access, scalability and pricing as data volumes grow, and usability for finance teams.
Key Considerations Before Implementing Business Intelligence for Financial Services
While many financial organizations are willing to enable business intelligence in their operations, only a few can actually do it: those who invested efforts into reshaping their companies’ culture and processes. To become one of the companies with BI-enabled functions, you need to address the following factors.
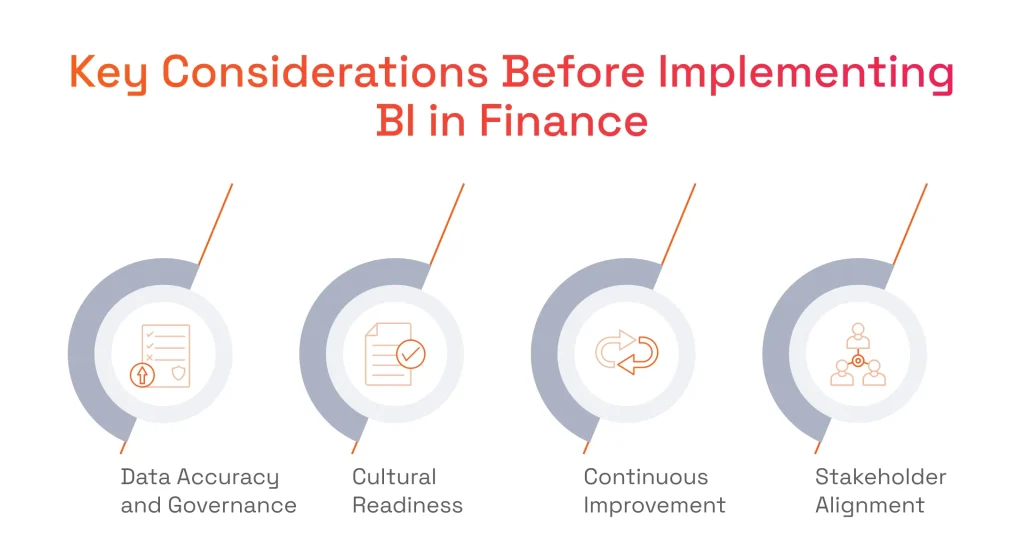
- Data Accuracy and Governance: Without clean data, even the most advanced BI tools will deliver unreliable insights and even lead to losses. In fact, Gartner estimates the cost of poor data quality at $15 million annually per organization, while 60% of companies don’t even measure these costs, meaning they’re operating blind to the waste bad data generates. To avoid these risks, organizations should establish clear data governance policies that define data ownership, standardize data formats, and set protocols for data validation. These policies often include regular audits, automated cleansing routines, data encryption standards, and clearly documented procedures for handling exceptions or discrepancies.
- Cultural Readiness: Implementing BI does not only require tech expertise. It also involves shifting how financial teams operate. A data-driven culture encourages all employees to use data as the foundation for making decisions. Such a cultural change demands continuous education, clear communication of benefits, and visible support from leadership.
- Continuous Improvement: Financial BI should be viewed as an evolving, iterative process rather than a one-time project. Initial deployments may scare the employees as they reveal user adoption challenges, data quality issues, or feature gaps in BI platforms. Instead of quitting data initiatives, organizations should embrace them as learning opportunities and collect feedback to further refine processes.
- Stakeholder Alignment: Securing buy-in from key stakeholders, including C-level executives, finance managers, IT teams, and end-users, lays the groundwork for seamless BI adoption. Early involvement of leadership is particularly critical: when executives prioritize BI initiatives, it sets an example that data-driven decision-making is now a business core principle. Hence, they can help unlock budget resources, facilitate cross-departmental collaboration, and remove organizational barriers that might hinder BI adoption.
Serhii Leleko
AI & ML Engineer at SPD Technology
“Adopting BI is a multifaceted process. It requires thorough planning and coordination for integrating BI tools with data infrastructure, aligning with strategic goals, training employees, fostering a data-driven culture, and ensuring IT-business collaboration.”
Building a Strategic Data Product Roadmap for Financial Platforms
Before finance teams can fully harness the power of financial business intelligence, organizations need a clear finance BI strategic data product consulting roadmap that aligns data infrastructure and analytics with long-term business goals. This means designing a cohesive architecture where data platforms integrate operational health data with business metrics into a unified foundation. Without this roadmap, even well-resourced organizations risk investing in tools that generate raw data without delivering meaningful financial analysis at the strategic level.
A well-structured roadmap typically evolves in phases: starting with an audit of existing relevant data sources and data collection practices, moving through data transformation and data warehousing, and culminating in advanced analytics and visualization layers tailored to the finance department’s needs. At each stage, financial professionals must ensure that big data travels freely across systems (e.g. accounting software, CRMs, ERPs, etc.), so that key financial metrics are always accurate, accessible, and actionable. Early identification of data quality gaps, before they compound into costly blind spots in financial operations, is one of the core advantages of this phased approach.
Too often, strategic decisions in finance happen in bursts driven by reporting cycles rather than real insight. A finance BI roadmap changes that by weaving data into the fabric of daily business operations. When data platforms integrate operational health data with business metrics in real time, CFOs and finance teams gain a living picture of financial performance that supports trend analysis, scenario modeling, and competitive positioning simultaneously. With this foundation set, organizations build a long-term competitive edge rooted in data-driven clarity.
BI for Finance: Step-by-Step Instruction to Strategic Implementation
We always suggest our clients to perform the integration of business intelligence in finance operations with a phased approach. By making one step at a time, the company can achieve a more mindful and productive BI implementation that ultimately yields substantial results in the company’s operation optimization.
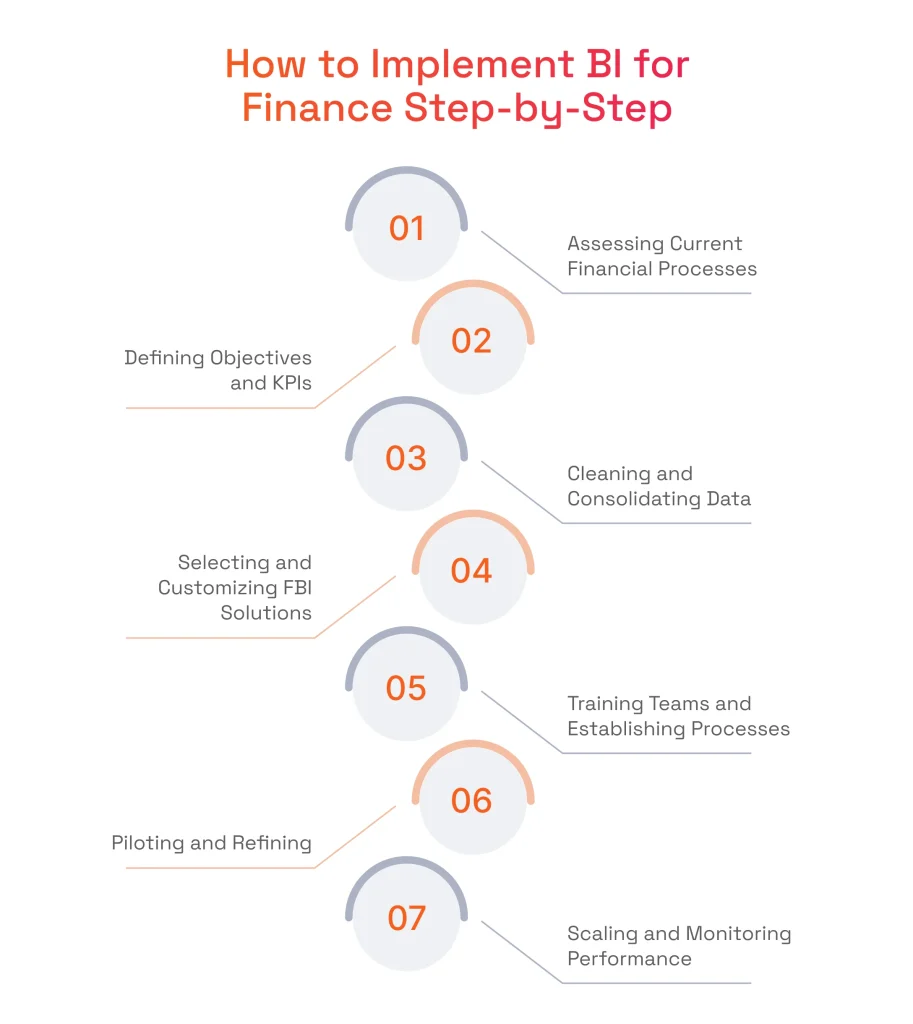
Step 1: Assessing Current Financial Processes
- Owner: CFO or finance operations lead, with IT.
- Output: current-state process map and a prioritized list of pain points.
We always recommend starting BI implementation with the evaluation of existing financial processes and workflows. In this fashion, the business gets the chance to map out how information currently moves through the organization, pinpoint gaps in data accessibility, and highlight areas of unnecessary complexity. At the same time, the company can identify pain points, such as data silos, manual reporting tasks, or redundant activities to be ready to address them in the next stages. By the end of this step, the company will see exactly where BI can bring the greatest value and how it should be integrated into the day-to-day operations.
Step 2: Defining Objectives and KPIs
- Owner: CFO and business stakeholders.
- Output: documented objectives and a KPI list with baselines and targets.
Before putting any BI technology into practice, it’s vital to clarify what the organization hopes to achieve with it. For that, the business needs to set specific objectives, such as reducing reporting time, improving accuracy in forecasting, or enhancing risk management. With these goals in mind, they can establish clear KPIs like the speed of financial close, forecast variance, or fraud detection rates. Thus, organizations can maintain focus on delivering tangible business outcomes rather than utilizing BI tools for technology’s sake alone.
Step 3: Cleaning and Consolidating Data
- Owner: head of data and data engineering team.
- Output: cleansed, consolidated data in a central warehouse and a documented data dictionary.
We always state that high-quality, well-governed data rules an effective BI implementation. This is why we usually advise companies to cleanse, standardize, and combine data from multiple sources before actually integrating BI tools. All data from spreadsheets, legacy systems, or disparate databases must be free from duplicate entries, consistent in data fields, and uniform in coding structures. Once cleansed and standardized, this data can be loaded into a centralized data warehousing infrastructure, creating a reliable single source of truth ready for BI processing.
Step 4: Selecting and Customizing FBI Solutions
- Owner: head of data, with IT and procurement.
- Output: selected platform and an agreed customization scope.
With clear objectives and reliable data in place, companies can move forward and evaluate different BI platforms that are suitable for the financial sector and their goals in particular. This entails comparing features like data visualization, predictive analytics, and integrated reporting capabilities. However, not all the off-the-shelf solutions can accommodate the unique processes or regulatory requirements that a company may face. In that case, additional customization can make sure the tool can cover the necessary requirements for scalability, usability, or functionality.
Step 5: Training Teams and Establishing Processes
- Owner: finance team leads and BI administrators.
- Output: trained users and documented workflows for data entry, validation, and analysis.
Even the most advanced business intelligence for financial services can only deliver value when users understand how to use them effectively. This is why we stress the importance of training on the new platforms and associated processes to our clients. During training sessions, like workshops or regular meetings, the company’s employees can understand how automated reporting, real-time dashboards, or predictive modeling work. At the same time, during such sessions, it is important to establish clear workflows for data entry, validation, and analysis in order to make sure data is always ready for BI processes from now on.
Step 6: Piloting and Refining
- Owner: project lead and pilot users.
- Output: pilot results, feedback log, and a prioritized fix list.
Before a full-scale rollout, organizations benefit from a pilot project or proof of concept with a limited scope. For example, we usually suggest running a BI tool solely for a specific financial process. In such a way, the organization can identify any technical bottlenecks, user adoption hurdles, or data integrity issues, collect feedback and address bugs and implement functionality improvements.
Step 7: Scaling and Monitoring Performance
- Owner: BI program owner or head of data.
- Output: rollout plan, KPI monitoring dashboard, and a regular review cadence.
Once the pilot has proven successful, finance organizations can scale the BI solution to additional departments, regions, or use cases. At this stage, continuous monitoring of performance and reviews against defined KPIs is crucial for demonstrating value to stakeholders. This ongoing evaluation ensures that the BI solution remains aligned with the organization’s overall strategies and objectives.
Read our in-depth guide on business intelligence implementation to learn a detailed breakdown of the stages involved.
Obstacles in Adopting Business Intelligence in Finance
FinTech app development challenges are significant on their own, and adopting business intelligence in the financial industry adds another layer of complexity to financial application development services. Our team has worked through each of the obstacles below on client projects.
The table below outlines each adoption obstacle, its underlying cause, the proven solution approach, and the business impact at stake.
Challenge | Root Cause | Solution Approach | Business Impact |
|---|---|---|---|
Data Privacy & Regulatory Compliance | Sensitive data exposure; strict GDPR, PCI DSS mandates | Governance frameworks; KYC; encryption and tokenization; automated compliance alerts | Regulatory fine avoidance; audit readiness; user trust |
Managing Data Complexity | Mixed formats across transactions, records, and market feeds | Standardized naming conventions; ETL and data virtualization | Consistent insights; lower integration overhead |
Real-Time Data Requirements | Batch processing delays; unoptimized pipelines | Real-time engines; in-memory databases; live dashboards with alerts | Faster decisions; reduced risk from data lag |
Legacy System Integration | Older mainframes incompatible with modern BI platforms | APIs and middleware connectors; phased cloud migration; virtualization layers | Unified data view without full-system rewrites |
High Costs & Resource Requirements | Large upfront investment; hard ROI justification for smaller firms | Cloud infrastructure; quick-win focus areas; open-source and commercial mix | Lower entry barrier; early demonstrable ROI |
Skill Gaps in BI & Analytics | Domain expertise present but data science and AI/ML skills lacking | Staff training; vendor knowledge transfer; dedicated BI hires | Faster adoption; growing internal capability |
Challenge
Data Privacy & Regulatory Compliance
Managing Data Complexity
Real-Time Data Requirements
Legacy System Integration
High Costs & Resource Requirements
Skill Gaps in BI & Analytics
Root Cause
Sensitive data exposure; strict GDPR, PCI DSS mandates
Mixed formats across transactions, records, and market feeds
Batch processing delays; unoptimized pipelines
Older mainframes incompatible with modern BI platforms
Large upfront investment; hard ROI justification for smaller firms
Domain expertise present but data science and AI/ML skills lacking
Solution Approach
Governance frameworks; KYC; encryption and tokenization; automated compliance alerts
Standardized naming conventions; ETL and data virtualization
Real-time engines; in-memory databases; live dashboards with alerts
APIs and middleware connectors; phased cloud migration; virtualization layers
Cloud infrastructure; quick-win focus areas; open-source and commercial mix
Staff training; vendor knowledge transfer; dedicated BI hires
Business Impact
Regulatory fine avoidance; audit readiness; user trust
Consistent insights; lower integration overhead
Faster decisions; reduced risk from data lag
Unified data view without full-system rewrites
Lower entry barrier; early demonstrable ROI
Faster adoption; growing internal capability
Each of these challenges is explored in detail below.
Data Privacy and Regulatory Compliance
Ensuring data security in FinTech apps is of paramount importance, since they store highly sensitive information. This data can be a subject to identity theft, unauthorized access, and various cyberattacks that compromise both user trust and the integrity of the financial services companies. At the same time, financial organizations need to deal with regulations like GDPR, PCI DSS, and various banking mandates. We always help our clients to comply with regulatory standards in order to prevent them from being subjected to significant fines.
To navigate these challenges, we:
- Develop clear data governance frameworks that outline data ownership, access controls, and usage policies.
- Implement KYC standards to verify customer identities, ensure regulatory compliance, and prevent fraudulent activities.
- Use BI tools with built-in compliance features, automated reporting, and real-time alerts to quickly identify potential breaches.
- Incorporate encryption, tokenization, and de-identification techniques to minimize exposure of personally identifiable information.
Managing Data Complexity
As mentioned above, financial companies accumulate vast amounts of data from transactions, customer records, market feeds, and other sources. This variety of data formats and volume can complicate the ability to integrate data, cleanse, and analyze it effectively. Consequently, this can result in inefficient implementation of business intelligence in financial services that generate inconsistent or even unreliable insights.
To address this obstacle, we:
- Standardize data formats and naming conventions to reduce confusion and inconsistency.
- Employ ETL processes or data virtualization solutions to manage and unify data from disparate sources.
Real-Time Data Requirements
Our clients working in the financial sector always state the importance of timely decisions and ask us to eliminate any delays in data availability or its comprehensive analysis when we collaborate with them on BI tools development or integration. This is important as it allows companies to seize more opportunities and decrease risks. Ensuring real-time or near-real-time data feeds demands advanced infrastructure and optimized processes, which can be challenging to implement.
To manage this complexity, we:
- Invest in real-time processing engines to capture and process data continuously.
- Use in-memory databases and distributed computing to handle large volumes of live data quickly.
- Implement real-time dashboards and alerts to quickly identify bottlenecks or delays in data pipelines.
Legacy System Integration
Many financial institutions rely on older core banking systems, mainframes, and proprietary solutions that do not natively integrate with modern BI platforms and can not exchange data with them seamlessly. However, the importance of data integration and system interoperability is obvious here as it supports analytics and ensures timely insights by providing a unified view of all financial data.
To make legacy system works seamlessly with BI tools, we:
- Use APIs and middleware connectors to bridge legacy and modern systems without extensive rewrites.
- Perform migration to cloud with prioritizing high-impact modules to spread out costs and reduce risks associated with large-scale overhauls.
- Employ a virtualization layer to allow BI tools to access data from legacy systems in near-real-time without fully restructuring them.
High Costs and Resource Requirements
Deploying BI tools, hiring skilled professionals, and maintaining advanced analytics platforms often requires substantial expenses. From our experience, this is especially painful for smaller or mid-tier financial institutions that may struggle to justify these costs, especially without instant ROI.
We usually solve this problem with the following tactics:
- Leverage the benefits of cloud computing to minimize upfront hardware and infrastructure investments.
- Focus initial BI efforts on the most value-adding or cost-saving areas to demonstrate quick wins.
- Combine open-source analytics solutions with commercial platforms to reduce licensing fees.
- Opt for solutions that can scale up or down based on usage, preventing overinvestment in underutilized resources.
Skill Gaps in BI and Analytics
The companies that hired us for implementing BI often required a blend of technical and analytical skills. This is because their in-house team usually are well-versed in the domain-specific tasks but lack expertise in areas such as data science, AI/ML development, or advanced data analytics. Without our help, they may experience slow adoption.
To help these companies get quicker results with BI, we:
- Provide ongoing training and workshops to upskill existing staff in BI tools, data analytics, and visualization best practices.
- Collaborate with technology vendors to fill immediate skill gaps and accelerate knowledge transfer.
- Recruit data scientists, BI analysts, or data engineers who can drive BI financial analytics initiatives and mentor internal teams.
Business Intelligence for Financial Services: Why Partner with SPD Technology
Implementing business intelligence for finance calls for expertise in AI/ML, data engineering, and advanced analytics, combined with a working knowledge of financial regulations. In-house teams usually bring deep domain knowledge, and an experienced technology partner adds the engineering depth that speeds up delivery and reduces implementation risk.
SPD Technology has over 20 years of experience delivering financial applications for clients including PitchBook, Mogami, and Poynt. Through our data analytics services, we support financial BI projects with:
- Regulatory Compliance Expertise: We build BI solutions in line with GDPR, PCI DSS, and other financial regulations, from access controls and audit trails to encryption of sensitive data.
- Experience Across Financial Niches: Our teams have worked in banking, insurance, and asset management, so BI solutions reflect the workflows and pain points of each sector.
- Customization for Financial Use Cases: We build BI solutions for risk modeling, fraud detection, portfolio analysis, and customer segmentation.
- Scalable Data Architecture: We design data architectures that handle growing data volumes while keeping data accurate and reliable.
- Cost Efficiency: We use cloud-based BI infrastructure to optimize resource use and reduce upfront investment.
- Long-Term Support: Some of our client partnerships have lasted over a decade, and we keep BI solutions updated as technologies and requirements change.
Business Intelligence Financial Services SPD Technology’s Success Story
We have collaborated with Mogami, a financial services company, for over 10 years. Together, we have created a personal finance management application, powered with analytics and data visualization, that steadily attracts new users.
Business Challenge
Our client needed to develop a personal finance management application to accommodate a big number of users with streamlining their financial lives. The app needed to be integrated with banking accounts to collect financial data (expenses, income, etc.), analyze that information and offer users insights on how to improve spending habits.
SPD Technology’s Approach
We opted for React Native development to create one app that can work on both, Android and iOS platforms. This allowed us to cover a larger audience. However, the app was built on an architecture-rigid foundation that in conjunction with banking integrations slowed down performance and prevented us from adding any new features and scaling the software. However, we migrated the app to the cloud and managed to pinpoint areas with poor performance and created custom solutions to resolve those.
One of the major parts of the project was enabling real-time tracking of expenses and insights into spending patterns. We developed an intuitive interface that supports personalized budget planning, making it easy to set goals and monitor progress. Beyond day-to-day expense tracking, Mogami provides users with actionable recommendations to optimize their finances, improve savings, and foster healthier spending habits.
Value Delivered
We successfully delivered a financial planning application for the Mogami team. The collaboration with them was so fruitful and productive that we continued working with them, enhancing their applications and providing ongoing support. The app continues to receive new active users and is a solid player on the market.
Key Takeaways
- 77% of CFOs are increasing technology spending and 76% now own data and analytics strategy, making financial BI a core part of finance leadership.
- Real-time dashboards and automated alerts let finance teams respond to cash flow changes, fraud signals, and market shifts as they happen.
- Gartner estimates poor data quality costs organizations $15 million a year, and 60% of companies don’t measure this cost, so data governance comes first.
- Implementation order follows data readiness: KPI reporting needs consolidated data, forecasting needs clean history, and fraud detection needs streaming pipelines.
- Choosing financial BI software means matching tool categories to your use cases and deciding whether to buy, configure, or build.
- Adoption depends on organizational readiness: leadership support, stakeholder alignment, and a phased rollout with a pilot decide whether teams use the tools.
- Compliance, data complexity, real-time requirements, legacy integration, costs, and skill gaps are the main obstacles, and governance, integration layers, cloud infrastructure, and upskilling address them.
In short: Financial business intelligence delivers results when clean, governed data, the right infrastructure, and organizational readiness come together.
FAQ
How much does a financial business intelligence platform cost to build?
Building a financial BI platform generally ranges from $150,000 to over $1,500,000. Mid-market deployments typically cost $200,000 to $500,000. The total includes data warehouse infrastructure, secure ETL pipelines, and reporting software like Power BI or Tableau. Costs quickly scale upward for complex enterprise financial networks requiring real-time ledger syncing, high-frequency market data integrations, and advanced SOC 2 Type II data security protocols.
What are the most common BI implementation failures in financial services?
The primary failure is treating BI as a purely technical IT project rather than a business-driven initiative. Financial firms often make the mistake of overcomplicating systems by dumping massive, unfiltered data into dense dashboards, which creates information overload. Other common failures include lack of explicit executive backing, weak user adoption when staff quietly fall back on Excel, and failing to establish clear owners for specific financial KPIs.
How long does a financial BI platform implementation take?
A full financial BI implementation typically takes 4 to 12 months to complete. The initial phase consumes 1 to 2 months mapping strict compliance rules and charting financial schemas. Building backend infrastructure and consolidating core ledger data takes another 3 to 6 months. The final months are dedicated to designing executive dashboards, rigorous double-entry accounting reconciliation, and training corporate analysts.
What data quality issues most frequently undermine financial BI systems?
Financial dashboards lose credibility instantly due to three specific errors:
- Inconsistent Master Data: Variations across accounting books where the exact same transaction or client is categorized differently between systems.
- Missing or Null Fields: Incomplete database entries that quietly break automated currency conversions or consolidation scripts.
- Timing Mismatches: Sync delays between real-time transaction processing networks and legacy batch-processed ERP systems, which distort close-of-day balances.
What is the difference between financial reporting and financial BI?
Financial reporting is rigid, structured, and retrospective. It provides static, compliance-driven documents, such as balance sheets, income statements, and cash flow reports, strictly tailored to meet external regulatory and tax standards.
Financial BI is interactive, analytical, and operational. It integrates disparate corporate data systems into dynamic dashboards, allowing management to build predictive simulations, analyze real-time profit margins by product line, and drill down into daily operational cash drivers.
How do I choose financial business intelligence software?
To choose financial BI software, start with the use cases and KPIs defined in your implementation plan, then evaluate tools against five criteria: integration with your ERP, accounting, and transaction systems; the data freshness your use cases require; compliance features such as role-based access, audit trails, and encryption; scalability and pricing as users and data volumes grow; and usability for finance teams. Run a pilot on one financial process before committing to an enterprise license.
What is the difference between financial BI and general business intelligence?
General business intelligence covers data across the whole organization, including sales, marketing, operations, and HR. Financial BI focuses on finance data and workflows: the general ledger, cash flow, budgets, forecasts, and regulatory reporting. This focus brings specific requirements, such as reconciliation with accounting records, audit trails, period-close logic, multi-currency and multi-entity consolidation, and compliance controls for frameworks like GDPR and PCI DSS.