

In 2025, data becomes the foundation of successful businesses that take leading market positions. Leveraging data for decision-making is no longer optional but necessary for sustainable business growth. Global organizations are understanding this and investing heavily in BI and its advanced tools. In fact, according to Statista, the projected revenue of the BI software market is expected to reach an astonishing USD 29.51 billion by the end of this year.
Unfortunately, despite these massive investments and promises, Data Orbis and many other sources report that 4 of 5 BI projects still fail. Lacking effective visualization is one of the key reasons for this sad statistic.
Data visualization’s importance is undeniable, since it goes beyond just creating attractive graphics, and is all about telling a clear and actionable story of what’s happening in your organization. So, opting for professional business intelligence and data visualization services is imperative for transforming raw information into intuitive visual narratives that will eventually turn into profits and a competitive advantage.
What Is Data Visualization and Business Intelligence
BI is an end-to-end process that includes data collection, data cleaning and preparation, and analytical querying and reporting, as well as presenting that data in the form of visually intuitive dashboards. Its main goal is to turn raw data into actionable insights to benefit overall strategy and critical operations. Data mining is a key component of BI, involving extracting meaningful patterns and insights from large datasets. Data warehouses are essential for collecting, processing, and storing raw data to facilitate analysis and decision-making.
On the other hand, data visualization is a graphical representation of data using elements including charts, graphs, and maps – presented in a dedicated dashboard. Its purpose is to make complex data more accessible and comprehensible to users. Visualization is especially useful for interpreting large volumes of quantitative data.
Difference Between Data Visualization and Business Intelligence
While closely connected, the two concepts serve different yet complementary roles. Let’s examine the difference between data visualization and business intelligence.
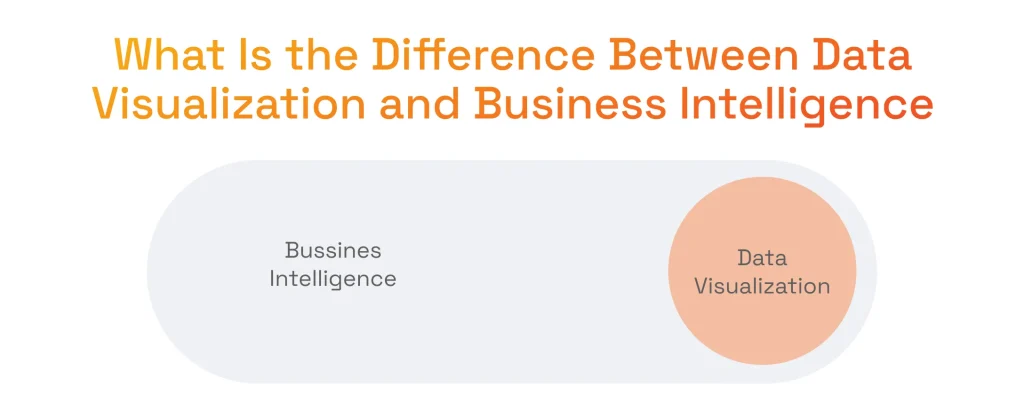
The biggest difference lies in the scope of the two. While BI is an end-to-end process, data visualization is solely about presenting, displaying, and interpreting information most conveniently. Data visualization is an essential part of business intelligence because, once BI tools complete data analysis, data visualization serves as a bridge between information and making the right decisions throughout the business.
Business analytics is closely related, focusing on predictive and prescriptive data analysis to guide strategic decisions and answer questions like ‘what will happen?’ and ‘what should we do?’. Additionally, a well-defined BI strategy is essential for leveraging data and technology to achieve business goals.
The Importance of Data Visualization for BI
Data visualization makes complex datasets in different formats easy to understand for key decision makers, and act upon those data-based insights. It is probably the most significant value that data visualization brings to the table.
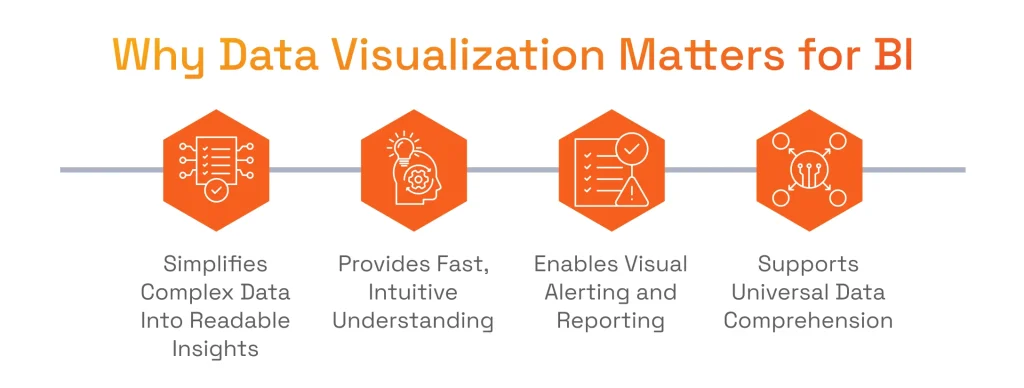
So, the significance of data visualization is so prominent because it:
- Simplifies Complex Data: powerful visualization tools allow converting complex and intricate datasets into digestible formats with obvious correlations.
- Delivers Quick and Key Insights: there is no need to go through numerous spreadsheets to make sense of data, since it will be easy to comprehend key metrics and trends.
- Provides Intuitive and Universal Understanding: both analysts and non-technical users will get access to insights, ensuring alignment across all departments.
- Enables Data-Driven Alerts: modern AI data visualization and BI tools can flag anomalies and trigger real-time alerts, allowing immediate action on emerging issues.
- Allows for Visual Reporting: easy-to-understand reports boost engagement and improve organizational data literacy.
- Facilitates Performance Comparison: visualizing data allows companies to compare current performance with past performance to predict metrics such as monthly sales or KPIs.
- Motivates Teams: data visualization can help motivate teams by providing a way to visualize the pipeline and measure performance.
- Helps Spot Issues Quickly: visuals allow managers to quickly spot issues like supply chain bottlenecks or marketing underperformance.
Modern BI tools enable users to create reports and dashboards independently, streamlining reporting processes and reducing reliance on IT. Visual analytics plays a crucial role in helping users understand data through interactive dashboards, ad hoc reporting, and advanced visualization tools.
AI Data Visualization and Business Intelligence Innovation: How AI Enhances BI
Just like with many other industries, Artificial Intelligence is a game-changer for business intelligence (BI) and data visualization. As the global AI market is projected to reach USD 244.22 billion in 2025, according to Statista, a significant part of this market is focused on machine learning and Natural Language Processing, which help companies effectively interact with data.
AI helps to reimagine the ways that traditional BI tools operate, introducing an entirely new level of optimization and automation to the data analysis process:
- Machine Learning: instead of relying only on static queries and historical data, proper machine learning expertise unlocks the possibility of learning from new inputs and adapting over time, generating evolving data insights without additional manual intervention.
- Natural Language Processing (NLP): this technology makes it easy to interact with data assets in plain language. Instead of scrolling through dashboards and setting different filters, the user can simply ask with voice or through text form for the needed information or report, and the business intelligence system will compile the needed information.
- Automated Data Preparation and Analysis: AI can also help with cleaning, categorizing, and visualizing data with minimal to no human input, saving massive amounts of time and reducing the risks of costly human errors.
- Predictive Analysis: AI-powered tools integrate predictive analysis to provide advanced forecasting, scenario analysis, and support for strategic decision-making, giving organizations a competitive edge.
- Interactive Data Exploration: AI-driven BI platforms enable users to perform interactive data exploration, allowing them to drill down, filter, and examine data in detail to uncover hidden insights.
- Enhanced Analytical Tools and Data Analytics: AI enhances analytical tools and data analytics by automating complex processes, supporting advanced statistical modeling, and enabling deeper interpretation and understanding of business data.
In addition to improving the performance, AI data visualization and BI innovation also introduce entirely new capabilities, compared to traditional approaches, including:
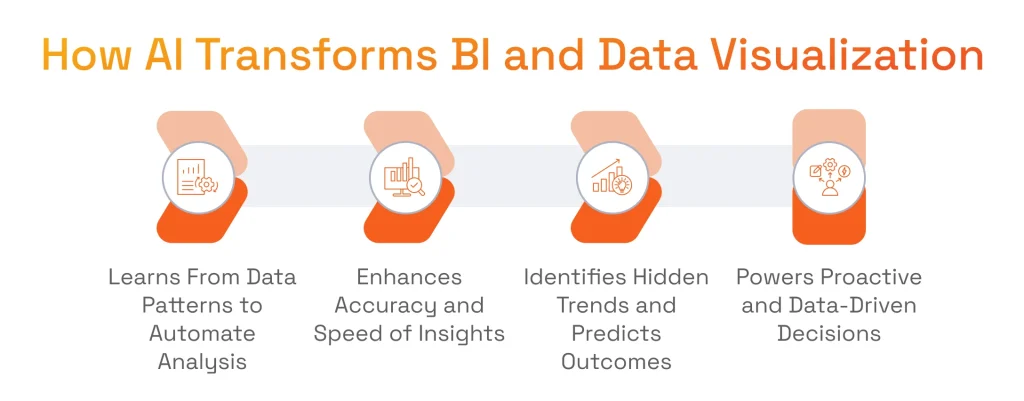
- Pattern Recognition: traditional analytics approaches lack the ability to detect hidden patterns and correlations within enormous datasets, while AI is specifically designed to excel at this.
- Predictive Analytics and Trend Forecasting: BI and data visualization software driven by AI is built to make accurate predictions on future trends and tendencies, for example, customer churn, inventory management, or changes in the market.
- Proactive Decision-Making: acting in real-time may be far more effective compared to simply reacting to static reports. AI-driven, automated recommendations enable key decision-makers to capitalize on opportunities.
Want to discover more use cases and possible opportunities of AI for Business Intelligence?
Read our featured article to benefit from our practical insights
AI Data Visualization and Business Intelligence Use-Cases
AI is changing BI with smarter and quicker predictive capabilities. When we add visualization to the mix, we end up with a powerful combination that becomes a paradigm shift for numerous industries. These use cases demonstrate how business applications benefit from the seamless integration of AI-powered BI and data visualization tools, enabling more effective decision-making and operational efficiency. Here are some of the most compelling use cases that showcase the potential of this integration.
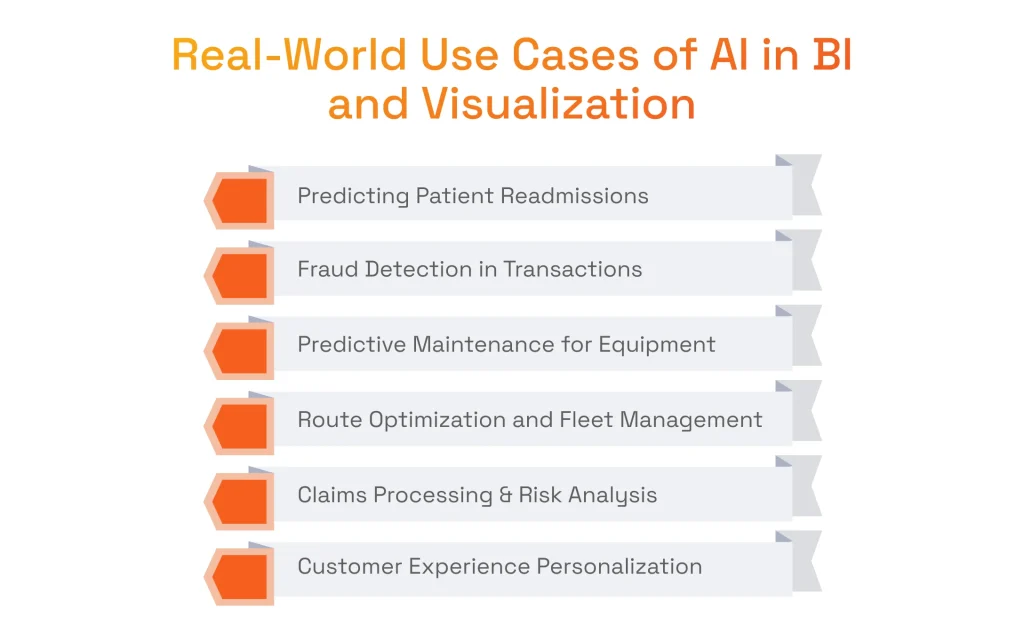
Predicting Patient Readmissions Using AI in BI
Healthcare business intelligence can be improved greatly thanks to the inclusion of AI-powered predictive analytics for forecasting patient readmission risks. AI systems are able to analyze principal historical data like demographics, medical history and lifestyle factors for determining how likely a patient will be readmitted within a month-long period. Access to current data through AI-powered dashboards enables healthcare providers to make timely interventions for at-risk patients.
Dmytro Tymofiiev
Delivery Manager at SPD Technology
“Thanks to machine learning models, it is possible to calculate individual risk scores and turn these predictions into easy-to-understand dashboards with real-time alert functionality. With this functionality, hospital staff can quickly detect high-risk patients and intervene with personalized treatment plans and individual approaches.”
Fraud Detection in Transactions Using AI and BI
Financial business intelligence can also benefit from AI. As an example, a financial institution that uses an AI module embedded in its AI platform can easily detect suspicious transactions, since AI can analyze user behavior, transaction history, and anomalies in real-time. By analyzing data from multiple sources, the AI module helps identify suspicious patterns and anomalies that may indicate fraudulent activity.
After data gathering analysis is completed and suspicious transactions are flagged, they are displayed on a dashboard with visual heatmaps and risk levels. Compliance experts and analysts can prioritize potential issues and initiate investigations promptly.
AI-Driven Predictive Maintenance for Manufacturing Equipment
In an innovative factory environment, there are different types of sensors that collect performance data from the equipment, including vibration and temperature. AI data visualization and BI use-cases in manufacturing include AI models in business intelligence systems to help prevent failures of the expensive equipment.
Visualization tools help to map machinery health on a dashboard across the entire production line. When specific components exhibit signs of wear and damage, the system alerts maintenance teams to act promptly and prevent any potential downtime. Predictive maintenance powered by tools directly contributes to improved business performance by reducing downtime and maintenance costs.
AI-Powered Route Optimization for Fleet Management
The logistics industry is also a part of the AI data visualization and business intelligence sector. For instance, consider a logistics company that utilizes the combination of AI and BI to optimize its delivery routes. This system can effectively process traffic patterns, weather conditions, fuel usage, and delivery schedules to optimize operations. Geographical data is used to analyze and visualize delivery routes, traffic patterns, and location-specific factors, providing deeper insights for route optimization.
AI helps determine the best possible routes for each vehicle, while data visualization displays them on an interactive map. Fleet managers can adjust schedules, reduce delivery times, and lower fuel consumption.
Claims Processing and Risk Assessment with AI
The importance of data integration is just as significant in the insurance industry, as the prominent use case includes an insurance company that integrates AI with tools for streamlined claims processing and risk assessment. AI works with essential claims data, customer profiles, and external data sources, including driving records and geographic data. Additionally, customer data from multiple touchpoints is analyzed to improve risk assessment and personalize insurance offerings.
Data visualization business intelligence here works as a convenient dashboard that highlights any high-risk claims and fraudulent patterns. Underwriters using this solution can make more precise decisions and significantly reduce fraud.
AI for Customer Behavior Analysis and Personalized Banking
Modern banking and eCommerce business intelligence are leveraging AI for customer behavior analysis. As a use case, consider a retail bank that utilizes AI algorithms within its BI ecosystem for in-depth analysis of customer behavior and preferences. This system uses transaction data, digital interaction logs, and lifestyle indicators to segment users and predict needs. BI tools help banks understand customer behavior, enabling more effective marketing and product recommendations.
When these insights are obtained, they are visualized through customer journey dashboards and behavior heatmaps. Marketing teams use this visual data to launch personalized campaigns and recommend financial products, boosting engagement and revenue.
AI Data Visualization and Business Intelligence Trends
With the evolution of new, cutting-edge technologies, BI and data visualization enhanced capabilities allow for making insights even more actionable and accessible than ever before. The evolution of BI platforms is driven by the need for advanced features, seamless integration, and robust data security. Data security is an increasingly important trend in modern BI, as organizations seek to balance secure data management with empowering users to analyze and visualize data independently. Data scientists play a key role in leveraging these platforms for complex analytics and sophisticated visualizations. In this section, we will discuss the most prominent trends and how we use them to help our clients.
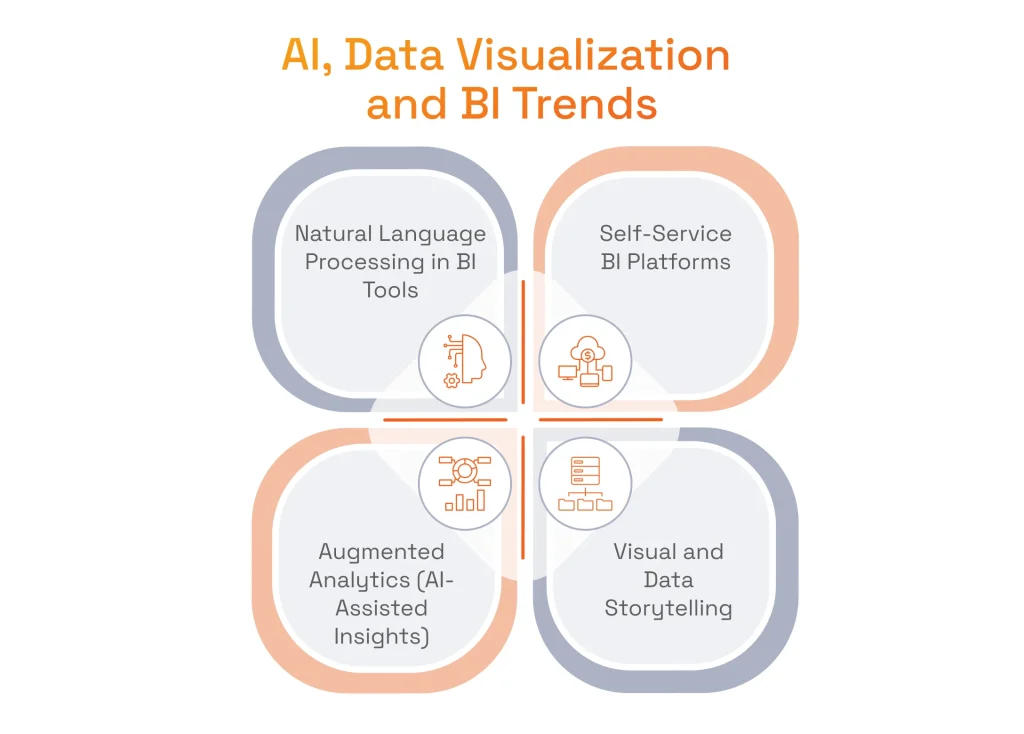
Natural Language Processing (NLP) in BI Tools
The market for Natural Language Processing is projected to reach USD 53.42 billion by the end of 2025, according to Statista, making it one of the most influential AI data visualization and business intelligence trends. This growth is supported by the ability for users to access complex datasets through simple, conversational language, eliminating the need to interact with SQL databases for sophisticated navigation.
We are already integrating the top BI platforms with NLP functionality, including Tableau’s Ask Data and Power BI with Copilot, connecting them to our clients’ existing data infrastructures. Fully understanding the business impact of Big Data, we optimize our models to work with enormous datasets and make the information easily accessible to all teams that need it.
Self-Service BI
Another fascinating trend is the shift to decentralized analytics, creating opportunities for business users to work with and visualize data without requiring IT expert involvement. Self service analytics empowers end-users to independently analyze data and create custom dashboards and reports, eliminating the need for IT to mediate every request. This speeds up decision-making across the board and promotes data literacy.
Our company has hands-on experience in designing and deploying advanced self-service BI ecosystems with embedded analytics for global clients, visualizing governed data layers with intuitive dashboards. We also conduct extensive training sessions for our clients’ employees to maximize the effectiveness of our solutions.
Augmented Analytics
With the help of machine learning algorithms, it is possible to completely automate data preparation processes, generate insights, and forecast trends. This helps to streamline analytics solutions, detect hidden patterns, and improve operational efficiency.
Here, at SPD Technology, we have the necessary expertise and experience in implementing modern analytics tools, including, but not limited to using Artificial Intelligence for customer behavior analysis, trend prediction, and identification of hidden patterns. We can help you analyze your unique business scenario and map out all possible use cases.
Data Storytelling and Visual Storytelling
Finally, another trend is emerging, where the focus extends beyond just visualization best practices to include the generation of narrative-driven insights. This means that there is data storytelling that helps provide context for the visuals, enabling business executives to clearly understand the reasons behind certain events. Data analysts play a crucial role in interpreting and communicating the stories behind these visualizations, ensuring that insights are both accurate and actionable.
We keep our finger on the pulse of all innovations, as this is not an exception. Our teams develop custom dashboards that provide data-driven story experiences. In particular, it is a combination of detailed visualizations, annotations on trends, and interactive elements, carefully embedded in the essential business workflows.
AI Data Visualization and Business Intelligence Future
Data visualization business value is set to grow, as there is a big expectation of an intuitive, powerful, and immersive tool. Leading platforms like Microsoft Power BI, Microsoft Dynamics, Google Analytics, and Looker are shaping the future of BI and data visualization. By leveraging the advantages of strategic technology consulting, organizations will be able to utilize the following innovations, make more informed business decisions, and optimize their decision making processes to act on data more effectively than ever before.
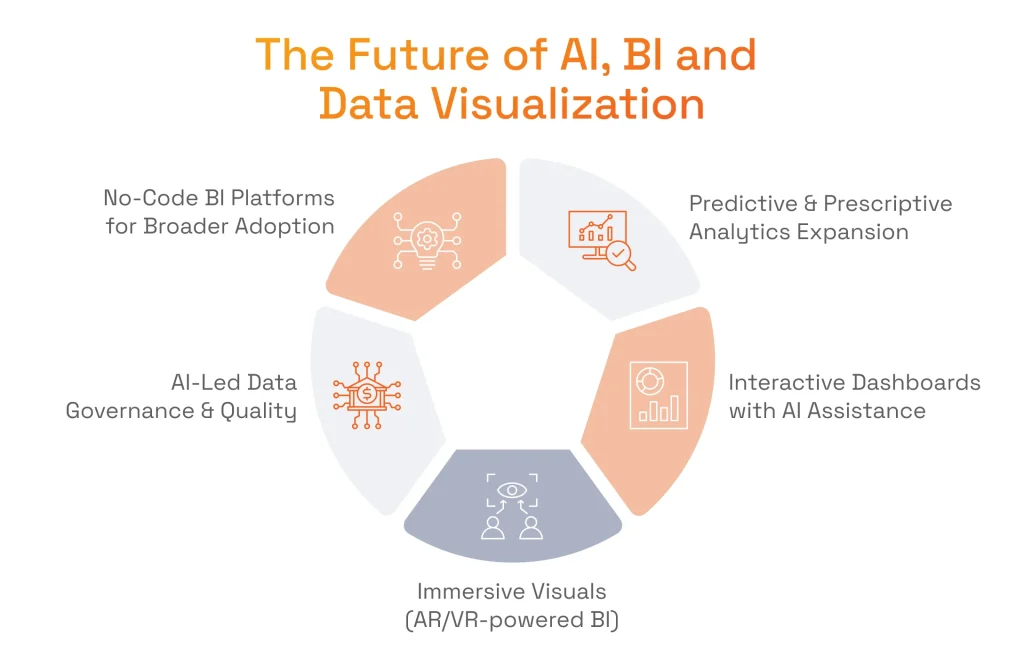
More Advanced Predictive and Prescriptive Analytics
While current BI platforms are already capable of forecasting future trends, the next generation of solutions will take it one step further and be able to recommend specific actions based on those predictions. For example, in addition to customer churn prediction, businesses will receive detailed retention strategies, as well as insights into budget constraints, based on data visualization and business intelligence.
Dmytro Tymofiiev
Delivery Manager at SPD Technology
“We are already experimenting with both predictive and prescriptive analytics, as we integrate advanced ML models in custom-built tools. While there is still a lot of room to grow and potential to be uncovered, we can certainly say that our clients can make decisions confidently based on scenario planning and automated recommendations.”
Smarter and More Interactive Dashboards
AI data visualization and business intelligence future is unimaginable without more intelligent dashboards that slowly turn into interactive environments. We can expect that passive displays will evolve into elements that respond lightning-fast to changes in user behavior and the market environment. Integrations with generative AI will make it possible for dashboards to summarize insights in plain language per the request of any user. We have already developed this type of dashboard, and they are able to learn from user preferences thanks to the skillful implementation of AI models.
Immersive Data Visualization with AR/VR
By 2029, the number of AR/VR users is projected to reach 3.7 billion, opening new ways to create BI and data visualization best practices. For instance, after adhering to AI data visualization and business intelligence regulations, companies in healthcare and manufacturing can leverage 3D environments to explore and understand large-scale, multidimensional data in a spatial manner. Our company has already started integrating AR/VR data experiences, just like we did in a cross-platform mobile app for the Space Needle.
AI-Powered Data Governance and Quality Control
Proper data quality management is essential for any organization, as AI-powered data governance and quality control can significantly improve this area. Maintaining the quality, security, and integrity of a company’s data is crucial for effective BI, as robust policies and procedures ensure reliable insights and compliance. This is achieved by ML algorithms that detect data inconsistencies, monitor pipeline health, and enforce compliance policies accurately and without much human intervention. In our projects, we often deploy AI agents to monitor data pipelines, flag errors, and maintain lineage for our clients.
Zero-Code Business Intelligence and Data Visualization Tools
Users no longer need to have a deep understanding of intricate technical aspects, as there is an emerging rise of zero-code tools. All business users can set up dashboards, run reports, or even customize predictive models with the help of drag-and-drop interfaces and commands in natural language. We consider zero-code BI environments as today’s standard, and help not only to implement them, but also empower the teams of our clients with training and governance frameworks.
Enhanced Data Integration and Interoperability
When done right, BI and Data Visualization can be seamlessly integrated with APIs, external data streams, IoT devices, and even unstructured content from emails or PDFs. Modern BI software enables seamless integration with various data sources and business applications. This replaces siloed departments working based on fragmented data with a unified view of all business processes. Capitalizing on the cloud computing infrastructure benefits, we architect cloud-native data ecosystems with real-time integration for our clients, ensuring that their custom BI systems reflect the full scope of operations.
Do you need help finding a trusted partner to implement the innovations mentioned above?
Read our featured article on business Intelligence consulting companies and find your perfect match!
Tap into the Opportunities of AI, Data Visualization and Business Intelligence with SPD Technology
Here, at SPD Technology, we have proven experience in delivering AI-powered BI solutions to clients of all sizes. We specialize in creating industry-specific software that addresses real-world challenges, tailoring solutions to the unique needs of a particular organization and its operational goals.
You can rely on us for full-service solutions, as we guide you from the initial consultation through to full-scale implementation, integration, improvement, and support as needed. We will ensure that your BI infrastructure will meet the highest security standards and regulations, from GDPR to HIPAA and beyond.
We are committed to transforming every engagement into a fruitful, long-term partnership, serving not just as a service provider but as a strategic partner to each of our clients. Our experts know how to work with all types of data visualization and BI to match your needs as your business evolves.
AI Data Visualization and Business Intelligence Case Study: SPD Technology’s Project
Let’s take a closer look at one of our recent projects to show how we deal with the implementation of BI and data visualization best practices.
HaulHub’s Major Transformation in Transportation Construction Using AI and Data
Business Challenge
Our client is HaulHub, a prominent B2B2C company that offers a digital platform for the transportation construction industry. The challenge was to develop entirely new components for the client’s leading platform, including EDOT, DOT slip, SupplierCI components, as well as AI/ML functionality.
SPD Technology’s Approach
After assembling an initial team of over 10 experts to take on this project, we began working on mobile and web applications for the EDOT platform while successfully involving all key stakeholders. The web platform was developed on Java with Quarkus on AWS Lambda and was powered by GraalVM for additional efficiency. Regarding the mobile aspect of the project, we created two native apps in Swift and Kotlin.
While working on data engineering, our team redesigned the DOT Slip component with better code quality and the integration of third-party data for more detailed visualization. We implemented custom BI visualization tools utilizing React.js, Chart.js, and Mapbox.
As for the SupplierCI component, our team optimized PostgreSQL with denormalization and caching, using AWS DMS and ETL processes for structured data integration.
This project also included a significant portion of AI/ML functionality. Our team created the content generation part with the help of OpenAI ChatGPT and AWS Bedrock for NLP. We developed recommendation systems using a Retrieval-Augmented Generation (RAG) approach.
Value Delivered
- Key Feature Development: our experts developed features including digital inspection, live construction activity view, activation, and environmental product declaration reporting.
- Effective Third-Party Services Integration: we integrated the platform into a broader ecosystem of transportation management tools.
This AI data visualization and business intelligence case study shows that our transformation in transportation construction became a major success. We remain partners with this client, working closely on improvements.
Conclusion
With massive amounts of data and advancements in data science, there is less challenge in accessing data, but rather in understanding it. The combination of BI, data visualization, and Artificial Intelligence helps organizations cut through complexity, capitalize on opportunities, and achieve tangible results.
Here, at SPD Technology, we provide a blend of decades of custom software development expertise, proficiency in BI platforms, and proven experience in AI/ML projects to help you benefit from data.
FAQ
What Is Business Intelligence and Data Visualization?
BI encompasses the technologies, processes, and practices used to collect, analyze, and present business data to support informed decision-making. Visualization, on the other hand, is the graphical representation of data using elements like charts, graphs, maps, and dashboards.
How Do Business Intelligence and Data Visualization Work Together?
Data visualization can be considered a component of the business intelligence process. While BI handles data collection, integration, and analysis, visualization presents the results in a way that is accessible and understandable for all stakeholders.
Why Is Data Visualization Important in Business Intelligence?
Data visualization enables a quick understanding of insights generated by BI. Without clear visualization, there can be some problems in understanding and interpreting complex analytics.
What Is the Difference Between Business Intelligence and Data Visualization?
Probably the most significant difference is in their scope. BI can be considered an end-to-end process, while data visualization focuses solely on the presentation aspect, displaying and interpreting information to support effective decision-making.