

As the sheer volume of global data hit 149 zettabytes in 2024, ignoring its potential is no longer an option. Forward-thinking organizations are leveraging the data to drive smarter decisions, and business intelligence (BI) tools are the ones helping them. These tools are in such high demand that the global BI software market is projected to generate $29.51 billion in revenue in 2025, with an expected annual growth rate (CAGR) of 5.35%, reaching approximately $36.35 billion by 2029.
Today, business intelligence implementation is essential for organizations to remain competitive and make data-based, wise, and relevant decisions. This article breaks down the business intelligence implementation steps and uncovers why modern tools are critical for business success, what best practices to follow, and how to overcome the most common challenges.
The Cutting-Edge Benefits of Successful BI Implementation
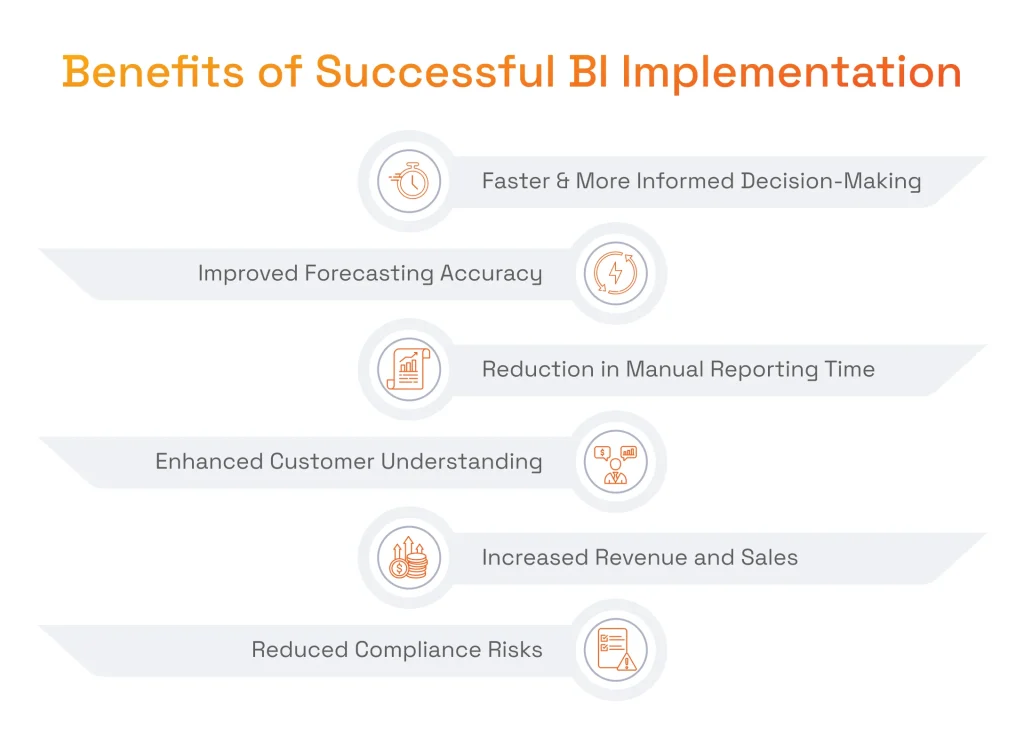
BI implementation is indispensable for fully capturing the business impact of Big Data: raw data has no value until it is turned into practical insights a company can act on. Equipped with BI tools, businesses gain access to:
- Faster, More Informed Decision-Making Across All Levels: Business intelligence infrastructure implies having a single source of truth for the whole company. With such a centralized place for all business data, all employees can access the same data and prepare reports and dashboards with complete, relevant, and accurate information. BI insights and data insights provide business value by enabling actionable, real-time decision-making and process improvements that drive organizational success.
- Improved Forecasting Accuracy Through Predictive Analytics: Modern tools often include predictive analytics capabilities. This allows organizations to detect trends and patterns that might otherwise go unnoticed. Decision-makers can thus forecast sales, demand, or other key performance indicators with greater precision. BI also offers financial forecasts, market trend analysis, and competitor insights, supporting better budgeting and goal setting.
- Significant Reduction in Manual Reporting Time: BI platforms automate much of the data extraction, transformation, and loading (ETL) process and can be set to refresh dashboards and reports in real time. This intelligent automation enablement significantly reduces effort and frees teams’ time to focus more on interpreting business data and acting on BI insights.
- Enhanced Customer Understanding & Personalization: Companies that set up business intelligence software aggregate their data from marketing campaigns, website interactions, social media, and support channels. This paves the way for analyzing this data to uncover demographic trends, buying behaviors, and engagement patterns and crafting their sales strategies according to new findings for personalized experiences and increased conversions. Business intelligence can also enhance inventory systems and supply chain management by providing accurate information for better communication with suppliers and distributors, leading to improved operational efficiency.
- Increased Revenue Through Better Sales & Pricing Analytics: Equipped with BI tools, companies can create sales dashboards and pricing analytics, which reveal insights into product performance, sales pipelines, and pricing strategies. In this way, decision-makers can understand which products or services are performing best to optimize their offerings, refine prices, and focus on the most profitable market segments.
- Reduced Compliance Risk via Auditable Reporting & Data Governance: To generate reliable insights, business intelligence software must use data in accordance with data governance and auditing rules. This ensures data accuracy, security, and traceability and helps organizations comply with industry regulations and standards.
- Proactive Risk Management: BI enables proactive risk management by identifying potential issues and disruptions early, helping organizations avoid compliance fines and reputational damage.
Implementing business intelligence can provide a competitive edge by allowing organizations to compare their metrics with competitors and identify areas for improvement.
Dmytro Tymofiiev
Delivery Manager at SPD Technology
“Having accurate, complete, and reliable business data centralized for BI tools creates a strong basis for adopting advanced technologies. Once this data infrastructure is in place, companies can start integrating AI and ML to set up intelligent automation, deploy AI-powered chatbots, or craft personalized recommendations.”
BI Implementation Project Plan: Key Phases
Business intelligence implementation requires a structured, methodical approach that follows clearly defined BI implementation steps. Developing and adhering to a business intelligence roadmap is essential, as it provides a strategic framework, sets milestones, and helps track progress throughout the BI deployment process.
It is crucial to assemble a project team with representatives from all departments involved to ensure collaborative communication, efficient planning, and successful execution of the BI implementation.
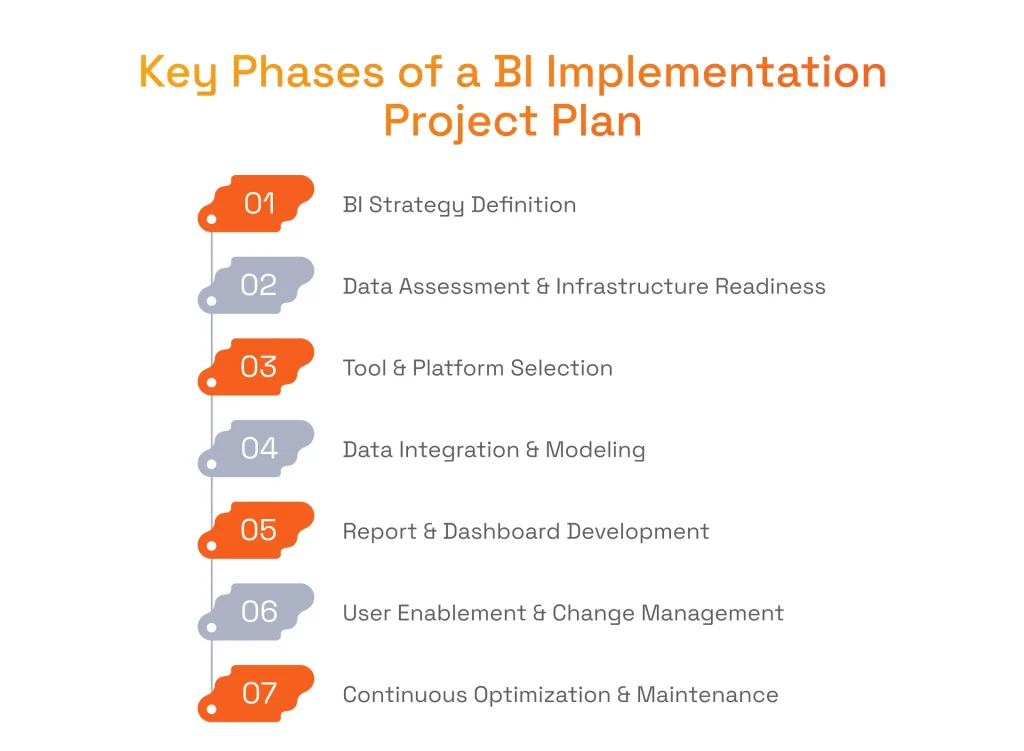
Phase 1: BI Strategy Definition
The first step is setting business objectives and identifying metrics to achieve them, which involves designing either a small and mid-sized business-oriented plan or an enterprise business intelligence strategy. In either scenario, the BI strategy should be created considering input from several teams, including finance, marketing, sales, operations, HR, to understand their expectation from BI initiatives.
An effective BI strategy starts with a feasibility study that analyzes business objectives, KPIs, the existing data landscape, and current analytics maturity. This comprehensive, well-planned approach is essential for leveraging data insights, driving growth, and transforming these insights into actionable outcomes.
For example, those can be increasing conversions or improving local sales. Once the goals are clearly defined, prioritizing high-impact metrics like conversion rate or total sales revenue will allow organizations to get clear criteria for achieving those objectives.
A successful BI strategy should also include a change management component to facilitate user adoption of new tools.
Phase 2: Data Assessment & Business Intelligence Infrastructure Readiness
As the next step, companies must review all current data sources, including spreadsheets and transactional databases, as well as BI infrastructure components such as third-party applications and SaaS platforms. Effective data management practices are essential at this stage, including the use of data marts as specialized subsets of data warehouses to support reporting and analysis within the overall BI infrastructure.
After such an evaluation, companies will be able to detect existing duplicate records, missing values, and other data issues. Establishing data cleansing and data quality management rules is crucial to ensure accuracy and consistency in business intelligence implementation.
They will also know how to resolve these issues to generate reliable insights. This evaluation will also help prepare this data for integration into a centralized repository for efficient storage and architecture. No matter what repository a company chooses, both data warehouse and data lake ensure the data is properly structured and integrated, and lay the groundwork for reliable reporting and analytics.
Preparing the data is a critical step that often takes up to four-fifths of the total BI development time.
Phase 3: Tool & Platform Selection
Selecting the right business intelligence tools is a critical step in business intelligence implementation. Companies must carefully choose a BI system that not only addresses specific tasks like real-time analytics, self-service reporting, and ad hoc data exploration, but also ensures data security, data quality management, and alignment with overall business goals. A well-designed BI system is essential for processing sensitive data securely and maintaining data integrity.
Stakeholder involvement is crucial in the selection process of business intelligence tools to ensure that the needs of all departments are met.
When selecting business intelligence tools, it is important to compare vendor offerings and consider service level agreements to make informed decisions.
What’s more, company’s decision-makers must have in mind the need for expanding their BI capabilities, which means adding new features as the business grows and creating space for new business records. This is why ensuring scalabilities from the very first steps of the BI implementation can change the game and eliminate future headaches. The best way to do this is by leveraging cloud computing infrastructure benefits.
Conceptualization and platform selection should result in a detailed project plan, project schedule, and communication plan.
Phase 4: Data Integration & Modeling
The importance of data integration lies in creating a trustworthy environment for all organizational data, which, consequently, will fuel effective BI. For that, companies must take such measures as creating ETL/ELT pipelines that will help move data from disparate source systems into a single repository, executing API integrations to sync data from all the systems, establishing consistent schemas to guarantee accurate joins, and ensuring proper modeling to ease data interpretation.
A crucial part of this process is data transformation, which involves extracting data from various sources, cleaning it, and converting it into a suitable format for data analysis and data visualization.
All these actions help create a single source of truth, which promotes consistency of all generated reports and dashboards across an entire organization.
Phase 5: Report & Dashboard Development
The next task for a company’s development team is to design dashboards and reports that translate raw data into actionable insights. The emphasis here is on usability and decision support, which implies that reports should be clear, concise, and relevant to each user’s responsibilities. In this manner, it becomes possible to ensure that the information provided guides both day-to-day operations and long-term planning.
During this phase, it is vital to make dashboards role-specific to help executives, managers, and employees have relevant information with different levels of detail. Another important thing is to follow visual best practices, such as clear charts and logical navigation, to ensure that business analytics and business intelligence solutions allow users to interpret data quickly.
Phase 6: User Enablement & Change Management
When organizational systems are finally equipped with BI capabilities, it is time to familiarize employees with how those can be used. At this point, companies must supply employees with training workshops and documentation to help with accessing and interpreting dashboards. Developing data literacy skills through targeted training is essential, as it enables employees to effectively work with data and supports data-driven decision-making across the organization. For instance, a company can arrange interactive sessions and e-learning modules to help users learn core features, build confidence, and discover best practices.
Another important factor in adopting business intelligence processes is ensuring ongoing dedicated support. This can be done by setting up helpdesks within each department to provide near-real-time assistance and create an atmosphere of mutual help.
Phase 7: Continuous Optimization & Maintenance
One of the vital business intelligence process steps that must not be overlooked is monitoring how the BI capabilities perform. For this, it is crucial to regularly monitor usage, system performance, and user feedback.
In the course of this monitoring, a company can spot issues that require fixing or areas of improvement because BI initiatives aren’t static and should grow alongside organizational needs. The result of these efforts can be refining data models, upgrading infrastructure, or adding new features, especially based on AI/ML, that will ultimately impact the bottom line.
Uncover the power of AI for business intelligence in our featured article.
Business Intelligence Best Practices for Success with Implementation
While each organization can have different expectations from data-driven initiatives, business intelligence integration or implementation still entails specific universal practices that ensure smooth deployment and user adoption. Below, we list the ones we follow when setting up BI capabilities for our clients.
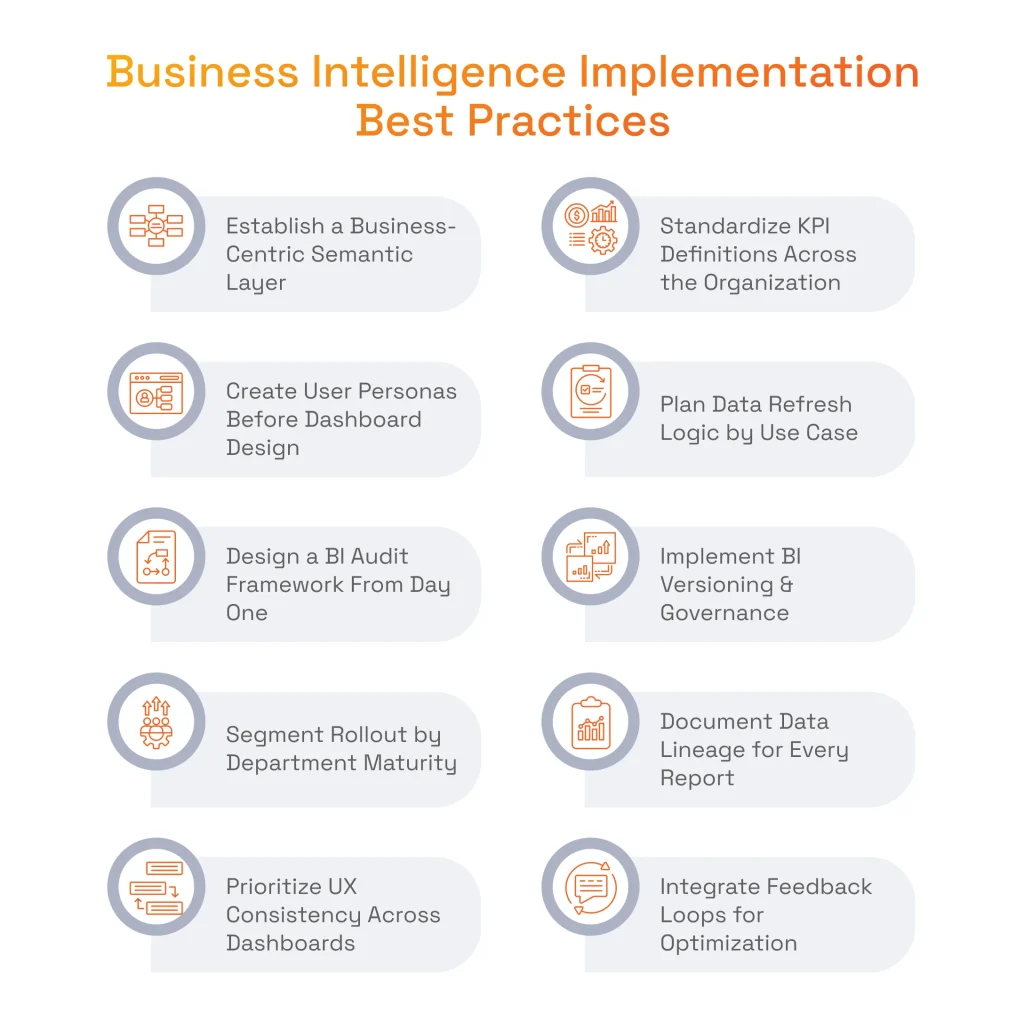
Establish a Business-Centric Semantic Layer
Having a semantic layer within an organization means that all employees and decision-makers are on the same page. A semantic layer acts as a shared “dictionary” of business terms, dimensions, and metrics written in a language everyone understands. With it, organizations do not have to invent how to interpret raw data: all definitions for key concepts are outlined, which brings clarity and consistency to operations. As a result, there’s less confusion over which numbers to use, fewer contradictory insights from the same dataset, and greater trust in BI outputs.
Standardize KPI Definitions Across the Organization
A central KPI catalog ensures that when someone says “revenue” or “conversion rate,” the organization universally agrees on what that means and how it’s calculated. Often, different teams might include or exclude certain fees, discounts, or channels, resulting in skewed comparisons. By explicitly defining standard formulas for key metrics (e.g., how to measure churn or gross margin), businesses eliminate the guesswork. This improves cross-departmental collaboration and preserves confidence in analytics.
Create User Personas and Role-Based Access Models Before Dashboard Design
When executives of an organization might only need high-level trend reports, analysts demand granular views. This is why it is vital to equip business intelligence workflows with role-based access for specific users. In this manner, specific data requirements, usage frequency, and necessary detail level will be available for the right specialist without overwhelming ones and undeserving information for others. What’s more, role-based access also safeguards sensitive information; for instance, HR data might be off-limits to most users, while sales figures are broadly accessible.
Plan for Data Refresh Logic and Latency Requirements per Use Case
Real-time data sounds appealing, but it often entails higher infrastructure costs and added system complexity. Moreover, not everyone in an organization needs instant report updates. The organization should match data update frequencies to actual decision-making needs, like monthly financial summaries for executives and near-real-time data for operations monitoring. Once these latency requirements are set up and data pipelines are designed to deliver precisely the level of freshness each use case demands, an organization gets free from the risk of wasting resources and overloading its systems.
Design a BI Audit Framework From Day One
Deeper understanding of system utilization can be made possible if companies establish clear audit logs, which can be used to pinpoint common dashboards, frequent user groups, or possible adoption obstacles. They also play a critical role in security and compliance because they provide the confidence that only authorized personnel have viewed sensitive data. This is why companies must set up an auditable trail that records when reports and dashboards are accessed, by whom, and how they’re used. This can be done by assigning a unique identifier to each user or session and capturing usage logs at the BI tool level.
Implement BI Layer Versioning and Lifecycle Governance
The BI environment is like any other software application with distinct development, testing, and production stages. Strategic business intelligence implementation should have a structured release process to avoid similar or duplicative reports, which often confuse report outcomes. For this reason, organizations must use version control for dashboards, data models, and underlying code so teams can roll back to previous versions if errors occur and establish documented release procedures that dictate when and how updates move from development into production.
Segment Implementation by Analytics Maturity of Departments
Attempting an organization-wide BI implementation from the start can overwhelm resources and minimize impact. This is why this BI process has to be incremental: a company can start with departments that already demonstrate higher levels of data sophistication and then move to other business functions. Thanks to this method, a business can see the benefits of BI projects before expanding them as well as spot any implementation issues that can be fixed by a development team during the next phases.
Document the Data Lineage for Every Report
When stakeholders question the source or methodology behind certain numbers, referencing the lineage quickly resolves concerns. Each KPI or data visualization is backed by a clear understanding of where this data is coming from and what transformation it experiences. Thus, an organization creates an atmosphere of transparency and fosters confidence in data from reports and dashboards. Moreover, data lineage allows organizations to simplify audits, as compliance teams can verify that the proper sources and changes were applied.
Prioritize Visual Consistency and UX Standards Across Dashboards
Users experience less friction when dashboards share consistent layouts and design cues. Intuitive dashboards allow users to quickly master the business intelligence basics and apply that knowledge across the entire BI suite. To offer this user-friendliness to users, organizations must adopt a cohesive design language for all BI artifacts. Further standardization of fonts, spacing, color schemes, and the placement of key filters or navigation elements also will help maintain a uniform look and feel.
Integrate Feedback Loops for Continuous Report Optimization
Over time, business priorities and data needs evolve. Without structured feedback, BI environments risk accumulating outdated or irrelevant reports, causing confusion and lowering overall usage. To avoid this issue, establishing formal and informal ways to gather user feedback on existing reports is crucial. This can be accomplished via embedded commenting features, survey forms, regular stakeholder review meetings, or usage analytics that track how often each dashboard is accessed. In this manner, the input can be used to refine existing dashboards, retire or consolidate underused reports, and guide the creation of new ones.
Dmytro Tymofiiev
Delivery Manager at SPD Technology
“If a company wants to keep the BI layer current, user-friendly, and closely aligned with the decisions that drive the business forward, it has to proactively monitor engagement metrics and collect user opinions.”
Common Challenges of Business Intelligence Integration and How SPD Technology Overcomes Them
During the process of business intelligence implementation, many organizations might encounter several challenges. This is not a reason to worry, as our experience shows that some issues are common and totally avoidable or resolvable. The main focus here should be on how to approach these challenges, and we offer you our methods below.
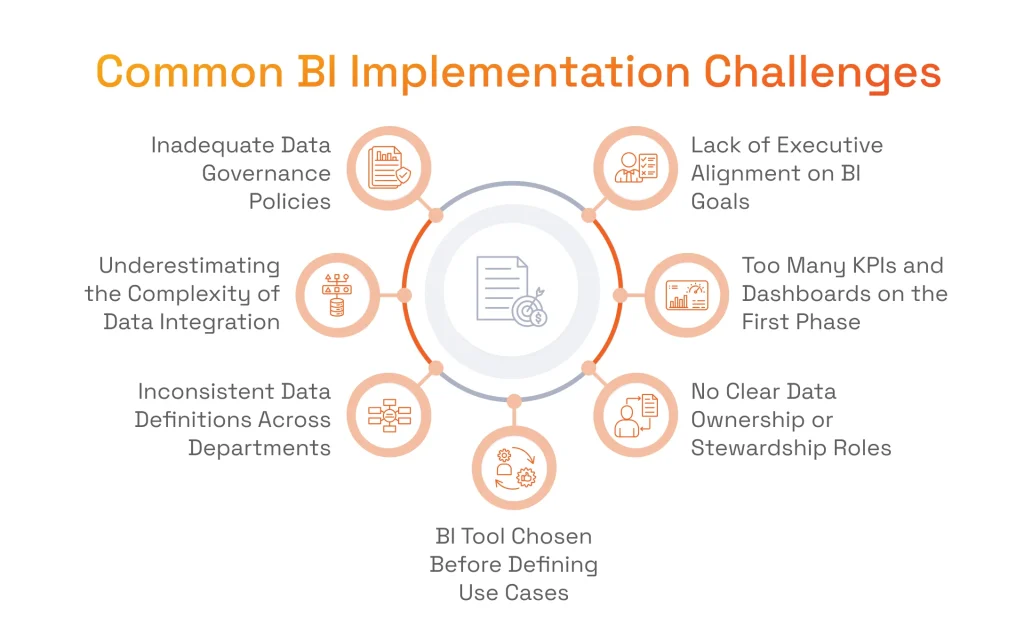
Lack of Executive Alignment on BI Goals
Some of our clients reported that different departments may seek different outcomes when it comes to business intelligence integration into their workflows. For example, marketing may seek to optimize campaign attribution, while finance focuses on forecast accuracy. As a result, our client’s company risked having a fragmented vision instead of data-driven suggestions.
To make sure that our clients have clear objectives at the executive level, we suggest doing the following:
- Facilitate cross-departmental workshops to define unified BI objectives.
- Draft a concise BI charter endorsed by executive sponsors.
- Establish a steering committee to harmonize and periodically review goals.
Overcomplicating the First Phase with Too Many KPIs or Dashboards
When our clients try to launch an extensive suite of dashboards immediately, we always highlight the risks that come with this approach. In particular, this overwhelms both development teams and end users, can require considerable investments that will not return investments right away and leaves no room for iterative learning or improvements.
Instead of doing all BI initiatives at once, we suggest changing the approach and opting for:
- Starting small with a core set of high-impact Key Performance Indicators.
- Validating and refining these initial dashboards before scaling up.
- Providing phased releases, gradually introducing new metrics.
No Clear Data Ownership or Stewardship Roles
In our projects, we stress the importance of assigning responsibilities for data accuracy and consistency. If we decide to neglect this factor, errors can go uncorrected for long stretches. It will lead to even greater problems over time: trust in the system erodes as users discover discrepancies and choose to go back to manual processes.
To ensure that our clients know who is accountable for data and stay on the path of promoting data-driven reporting, we do the following:
- Assign data stewards in each domain responsible for validation.
- Implement data quality management techniques.
- Define a clear escalation path for resolving critical data issues.
BI Tool Chosen Before Defining Business Use Cases
We never recommend selecting a BI platform purely based on brand reputation or feature sets. The reason for that is these platforms may not be suitable for specific organizational goals. When the tool mismatches workflows and objectives, adoption stalls and the BI initiative struggles to deliver value.
To choose BI platforms that will ideally fit the data initiatives an organization plans to perform, we recommend:
- Conducting a discovery phase to map existing workflows and data analytics requirements.
- Using pilot or proof-of-concept evaluations with real data to test tool suitability.
- Involving key stakeholders in the selection process to ensure alignment.
Inconsistent Data Definitions Across Departments
Our clients are often afraid of misinterpretation. The example of this can be when “revenue” in one team’s report includes shipping costs while another team excludes them. We understand that fear as these conflicting definitions create confusion and slow down the decision-making process.
Our approach to avoiding false definitions involves the following measures:
- Create a “data dictionary” or semantic layer with standardized definitions.
- Mandate that all dashboards reference these agreed-upon KPIs.
- Regularly review and update definitions as business logic evolves.
Underestimating the Complexity of Data Integration
When we bring together data from disparate systems like CRMs, ERPs, marketing platforms for our clients, our BI team encounters hidden format mismatches, missing fields, or restrictive APIs. These technical hurdles usually prevent us from implementing BI processes smoothly and require more time to deal with them. This can delay implementation schedules.
Important steps we take to prevent data quality from degrading during integration are:
- Allocating ample time for discovering and resolving integration challenges.
- Using ETL/ELT tools that can handle diverse data formats and transformations.
- Conducting a pilot integration project for high-priority data sources to refine your approach.
Inadequate Data Governance Policies from the Start
We always emphasize that organizations must treat governance with the utmost importance. This concerns security standards, compliance requirements, and user access levels. If they neglect data governance, they risk unintentional data exposure, regulatory fines, and general user apprehension.
We help our clients address governance tasks thanks to:
- Defining governance policies in parallel with BI planning.
- Setting role-based access controls and document data security measures.
- Providing ongoing training and audits to ensure compliance and user confidence.
Why Business Intelligence Implementation Strategy Requires a Pro Approach
When implementing BI, a complex approach is required. Companies must take care of data quality, data governance, storage, data visualization, and sometimes even predictive analytics enabled by data analytics services. However, their in-house teams may lack knowledge since their primary expertise is focused on the industry specifics. Luckily, there are tech vendors that can be hired to fill the skill gap. With a tech vendor as a partner, organizations can benefit from:
- Avoiding Costly Mistakes and Misalignment: A professional tech company starts by crafting a business intelligence implementation strategy. The advantages of this strategic technology consulting are planning of design, and architecture, establishing data governance, and introducing data quality management techniques. The experts can also keep all stakeholders working toward shared objectives, preventing disjointed efforts that waste time and resources. In this manner, everyone is on the same page from day one and works towards the same goal.
- Access to BI Strategists, Data Engineers, and Analytics Architects: Companies that specialize in business intelligent implementation services have a wide range of skill sets, covering everything from building robust data pipelines and defining KPIs to designing user-friendly dashboards. With such professional help, organizations gain immediate access to cutting-edge practices and advanced technical capabilities.
- End-to-End Support: A pro BI partner doesn’t stop at deployment. They help craft an overarching BI roadmap that aligns with business goals, ensure smooth implementation of business intelligence best practices for success, and provide continuous improvements. This means a tech partner helps organizations by updating data models, refining dashboards, or scaling infrastructure as data volumes grow.
Looking for the right partner for BI implementation?
Explore potential partners in our list of top business Intelligence consulting companies.
Consider SPD Technology for Business Intelligence Implementation Services
Our BI team helps many clients to leverage business intelligence solutions. We performed business intelligence implementation in the USA and Europe and helped leading companies to enhance their reporting capabilities.
- Our Expertise in Custom BI Strategy Development: Our team delivers tailored data strategy consulting services that address each client’s unique data challenges and goals. With a focus on aligning analytics to real-world business needs, our experts guarantee every BI project is built on a solid foundation.
- Scalable, Secure, and Future-Ready BI Architecture: We specialize in designing architectures that grow seamlessly with your organization. Our team builds solutions that prioritize data security, performance, and resilience for companies to be able to expand to multiple locations, add new data sources, or increase user counts.
- Compliant BI Solutions: Data privacy and regulatory compliance are integral to our BI implementations. Whether working with financial regulations, healthcare standards, or local data protection laws, our BI team ensures that each system meets industry-specific requirements.
- AI-Powered Insights, Intuitive Dashboards, and High Adoption Rates: From advanced predictive analytics to easy-to-navigate dashboards, our team emphasizes solutions that empower end users. For that, we combine our AI and machine learning expertise with user-centric design and, thus, deliver insights that are not only accurate but also readily understandable for each user.
Building an Enterprise Business Intelligence Strategy for HaulHub: SPD Technology’s Success Story
We make sure that the business intelligence process goes smoothly for each of our clients. Below is one of our success stories to confirm it.
Accelerating HaulHub’s Transportation Construction Platform with SPD Technology’s BI Expertise
HaulHub required an overhaul of its digital platform to unify multiple stakeholder solutions for agencies, contractors, vendors, and suppliers under one data-driven system.
Business Challenge
Some of the core tasks HaulHub requested us to do were to provide the platform users with accurate data on tonnages, materials, projects, plants, trucks, facilitate decision-making through custom dashboards and watchlists for monitoring top-performing plants and customers, present material ticketing data in a more concise way, and provide detailed information on project workloads.
SPD Technology’s Approach
Our team built a robust BI ecosystem for HaulHub. This system centralizes massive volumes of data for real-time reporting. Further, we used Java Quarkus on AWS, Swift for iOS, and Kotlin for Android for the integration of a serverless architecture, scalable data pipelines, and AI models (OpenAI ChatGPT, AWS Bedrock) for advanced data analytics. Thanks to all these efforts, we managed to enable precise data visualization of critical metrics, from project workloads to material usage.
Value Delivered
Thanks to our BI-centric enhancements, HaulHub’s platform now provides near real-time insights on materials, trucking, and project status, processed in under two seconds. Custom dashboards and watchlists empower users to monitor top-performing plants and customers, while concise ticketing data boosts operational efficiency. Our efforts resulted in a data-driven environment that simplifies management and fosters better collaboration among all the parties involved in the transportation construction process.

Conclusion
The implementation of BI solutions is a complex process but it is completely rewarding. The integration of business intelligence tools into organizational systems brings numerous benefits, namely informed decision-making, improved forecasting, reduced manual effort, better customer understanding, increased revenues, and decreased compliance risks.
To implement BI, companies must go through establishing of BI plan or strategy, assessing data and infrastructure, selecting tools, integrating data, setting up reports and dashboards, enabling users, and optimizing outcomes. In order to do it in the best possible way, we recommend following the next best practices: establishing a business-centric semantic layer, standardizing KPIs, creating user personas, planning data refresh logic and latency requirements, designing BI audit framework, implementing BI layer versioning, segmenting implementation, documenting data lineage, prioritizing visual consistency, and integrating feedback.
However, some organizations may require external expertise for BI implementation. Luckily, there are a lot of professional companies that are ready to help. Our team also helped to establish a robust business intelligence structure and processes for many clients. We can leverage our expertise for your project as well. Just contact us, and we will craft a BI solution that will suit your unique business goals.
FAQ
What Is Business Intelligence Implementation?
It is the systematic process of planning, designing, and deploying tools, processes, and infrastructure to transform raw data into insights that guide strategic and operational decisions. This involves data collection, integration, modeling, reporting, and governance, ensuring that accurate, timely information powers every level of an organization for sustained success.
What Are the 5 Stages of Business Intelligence?
Business Intelligence generally follows five stages: data collection, data storage, data analysis, data visualization, and action planning for lasting organizational value.
What Things Should You Do When Implementing Business Intelligence?
We recommend following these practices:
- Define clear objectives and KPIs, ensuring all stakeholders share a unified vision.
- Establish strong data governance for accuracy, security, and compliance.
- Select tools aligned with your use cases, then design role-specific dashboards.
- Provide comprehensive training and support, then refine continuously based on user feedback and evolving needs, ensuring future scalability.